
Here is a question worth more than most of the strategy debates I get dragged into: what is survivorship bias in backtesting, and how much of what you believe about trading is built on it? The short version is that you are almost always looking at a filtered sample. The instruments that are still listed, the strategies somebody kept, the traders who are still posting. The ones that died are not arguing their case, because they are gone, and their absence does not leave a mark on the chart.
I want to do more than define it. Further down I run the exact arithmetic on a group of traders who have, by construction, no skill whatsoever, and show you the track record the survivors end up holding. It is better than most people would believe, and none of it is real. If you run your account as a business, this is a supplier due diligence problem, not a maths curiosity.
What is survivorship bias in backtesting, precisely
Survivorship bias is what happens when the sample you test on was chosen, even implicitly, by the fact that it survived to the date you chose it. The data is honest. The selection is not.
It is worth separating it cleanly from the two neighbours I have written about before, because they get mixed up constantly and the fixes are different.
- Look ahead bias is using information in a test that nobody had at the time. The fix is a point in time dataset and strict ordering. I went through it in what is look ahead bias in backtesting.
- Overfitting is searching until something fits the noise. The fix is counting your attempts and holding out data. That one is in what is overfitting in trading.
- Survivorship bias is neither. You can have perfect timestamps and run exactly one test, no searching at all, and still get a badly inflated answer, because the list of things you tested was assembled by the present.
I will own an error here. In the look ahead piece I described survivorship bias as look ahead bias wearing a different hat. That was sloppy. They overlap at the edges, but they are separate failures with separate remedies, and treating survivorship as a subspecies of something else is exactly how it survives in a process that has already been tightened everywhere else.
The idea is not new and it is not mine. The formal treatment traders usually cite is Brown, Goetzmann, Ibbotson and Ross, "Survivorship Bias in Performance Studies", in the Review of Financial Studies volume 5, issue 4, 1992. Elton, Gruber and Blake followed with "Survivor Bias and Mutual Fund Performance" in the same journal, volume 9, issue 4, 1996. Both are about funds rather than retail accounts, and both reach the conclusion that matters here: strip out the dead and what is left looks better than the population ever was.
The version that lives in your data file
Start with the plain backtesting case, because it is the easiest to fix.
You decide to test a rule across a basket of instruments. You pull the list of what is tradeable today, download history for each, and run the test. The list you pulled has a property you did not ask for: everything on it is still alive. Anything delisted, merged, redenominated, or quietly dropped by your broker is missing, and those are disproportionately the ones that went badly.
In our corner the same thing turns up in less obvious clothing:
- Broker symbol lists. The pairs and CFDs your platform offers today are the ones with enough flow to be worth carrying. Instruments that were dropped for lack of interest, or because the spread could not be maintained, are not in the dropdown.
- Prop firm rule sets. Testing against the current rulebook of a firm that is still trading tells you nothing about the firms that wrote tighter rules and are no longer here.
- Strategy libraries. The folder of systems you kept is a survivor list. The ones you deleted after a bad month are the control group, and you destroyed it.
- Your own journal, if you prune it. A journal missing the period you would rather not revisit is a survivorship machine pointed at yourself.
The fix for the data version is mechanical: use a dataset that includes dead instruments with their delisting date, and if you cannot get one, say so in the write up and treat the result as an upper bound rather than an estimate. That is dull advice, and it is most of the job.
The version nobody fixes, because it is made of people
Now the part that costs real money. The sample you judge trading by is not mostly instruments. It is other traders, and that sample is filtered far harder than any symbol list.
About 109 messages in my inbox mention prop firms or funded accounts. That is a keyword count across my own inbox, not a survey of anything, but the shape of it is consistent. One reader wrote: "Too many blown prop firm accounts until I decided to put some money in a live account instead." Another, the same week: "I made 150 dollars profit in my funded account following your last trade." Only one of those two kinds of message tends to get posted in a public group, and it is not the first one.
So let me put a number on what that filtering does. I built a cohort of traders who have no edge at all. Every trade is a fair coin: heads plus one R, tails minus one R, probability exactly one half. No skill, no edge, nothing to find. Each trader stops for good the moment cumulative losses reach a set drawdown. Then I asked what the ones still standing look like at the end.
These are exact probabilities from dynamic programming, not a simulation. There is no random seed and no sampling error. Run the arithmetic yourself and you will get the same figures to the last digit.
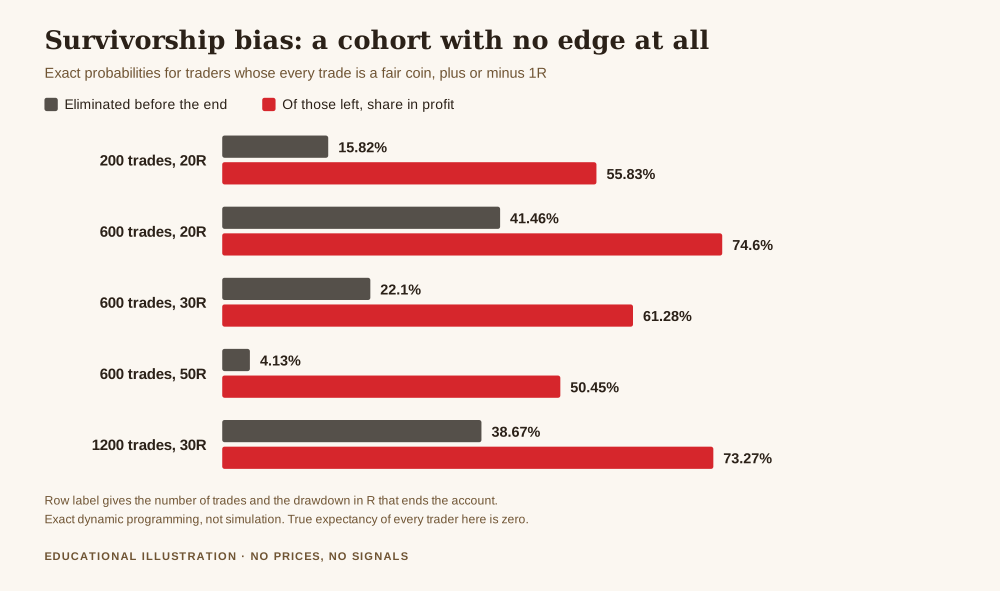
Take the second row. Six hundred trades, which is perhaps three years of active work, with the account closed if it ever sits 20R below where it started. Four in ten are gone before the end. Of the six in ten still trading, 74.6 per cent are in profit.
Read that again, because the whole article is in it. Three quarters of the visible group are showing a profit, and not one of them has any edge. Nobody cheated, nobody got lucky in a way that needs explaining. The profit is an artefact of the losers having left.
The harsher the cull, the better the survivors look
The second chart is the one I would pin above a desk.
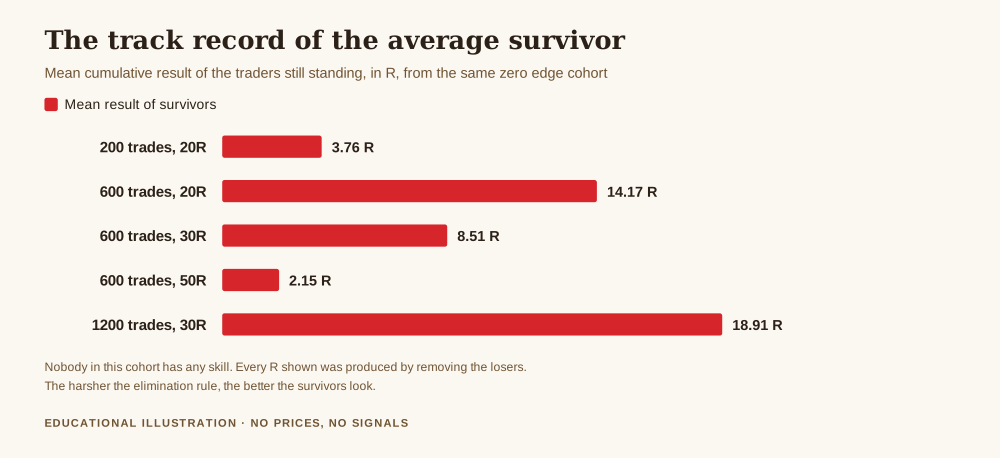
Hold the number of trades at 600 and change only the drawdown that ends an account. At 50R, a loose rule, barely anyone is removed and the average survivor shows plus 2.15R, close to the zero you would expect. Tighten to 30R and the survivor average climbs to plus 8.51R. Tighten to 20R and it reaches plus 14.17R.
The cohort did not improve. The filter got sharper. A stricter failure rule removes more of the left hand tail, and the average of what remains has to rise. This is arithmetic, not a market effect.
Which is uncomfortable, because strict drawdown limits are exactly what the funded account industry sells, and I have defended them myself as sound risk practice. Both things are true. A hard loss limit is good business practice for the individual, and it is also a machine for manufacturing impressive looking track records from nothing. The limit protects the trader. The published results of the people who passed tell you very little. If you want the economics of how that industry works, I set it out in how do prop firms make money.
How much evidence it takes to tell the difference
If the survivors look good whether or not anyone is skilled, how do you tell a real edge from the shape of the filter? You need enough trades that noise cannot account for the result.
Assume each trade's outcome has a standard deviation of about one R, which is roughly right for fixed fractional risk. To call a claimed edge real at the usual 95 per cent confidence, you need the average result times the square root of the number of trades to clear about 1.96. Rearranged, the number of trades you need is (1.96 divided by the edge) squared.
| Claimed edge per trade | Trades needed to show it is real | At 200 trades a year |
|---|---|---|
| 0.02 R | 9,604 | 48 years |
| 0.05 R | 1,537 | 7.7 years |
| 0.10 R | 385 | 1.9 years |
| 0.20 R | 97 | 6 months |
| 0.30 R | 43 | 11 weeks |
Now put that beside the survivor cohort. The average survivor in the 600 trade, 20R case finished at plus 14.17R, which across 600 trades works out at a t statistic of about 0.58. You need roughly 1.96. That record, which would look convincing in a screenshot and would pass most people's eye test, does not come close to demonstrating anything.
The practical reading is that small claimed edges need years of evidence, and large claimed edges need checking for a different reason, because a genuine 0.30R per trade edge is rare enough that the likeliest explanation of seeing one is that something in the sample is doing the work.
The rulebook already assumes this is happening
You do not have to take my word that selected results mislead. The regulations covering advertising in this industry are built around it.
The CFTC rule on advertising by commodity trading advisors, 17 CFR 4.41, says that any advertisement referring to a testimonial must prominently disclose "that the testimonial may not be representative of the experience of other clients". That sentence is a survivorship warning in legal clothing. The regulator is not worried the testimonial is forged. It is worried that it is true and unrepresentative, which is the more common and more persuasive problem.
The equivalent on the securities side, FINRA Rule 2210, goes further and addresses the omission directly: no member may "omit any material fact or qualification if the omission, in light of the context of the material presented, would cause the communications to be misleading". The traders who failed are a material fact. Leaving them out is the entire technique.
Neither rule binds a stranger posting a screenshot in a group chat, which is rather the point. The standard exists where there is accountability, and vanishes exactly where most people now get their impressions of what trading looks like.
What I actually do about it
Running the account as a business means having a procedure, not just an awareness. Mine is four checks, and none of them require any maths.
Ask for the denominator. Any result is a numerator. Before judging it, ask how many attempts it came out of. How many accounts did this person open. How many systems were in the folder before this one. How many members of the group started when this member did. If nobody can tell you the denominator, you have been shown a fraction with the bottom torn off.
Keep the dead in your own records. Every strategy I retire stays in the archive with its final numbers and the date I stopped. Every account I have closed stays in the ledger. It costs nothing to keep, and it is the only control group I will ever have for my own decisions. A pruned journal cannot tell you anything.
Treat the survival rule as separate from the result. When I review a quarter, I look at the risk limit and the outcome as two different lines. The limit is doing its job if it stops me reaching an unrecoverable place. Whether the quarter was profitable is a different question, and letting a good outcome vouch for the rule, or a bad outcome condemn it, is the same confusion in both directions. That split is built into the one page trading business plan I work from.
Discount visible success by how hard the filter was. If somebody passed an evaluation with a tight drawdown rule, the chart above says the pass is weak evidence of skill, because the rule manufactures passes from noise. Not no evidence. Weak evidence, and weaker the tighter the rule.
Get the free REX business plan template, one page covering your risk ceiling, your costs and the review schedule that keeps a record honest. One email, no spam, unsubscribe anytime.
Get the free business plan →Frequently asked questions
What is survivorship bias in backtesting, in one sentence?
It is the error you make when the instruments, strategies or people in your sample were included because they lasted long enough to be included, so the failures are missing and the average looks better than reality.
Is survivorship bias the same as overfitting?
No. Overfitting comes from searching too many variations until one fits the noise. Survivorship bias can ruin a single test run exactly once, because the damage was done when the sample was assembled, before any searching started.
Does survivorship bias apply to forex and gold, where nothing gets delisted?
The major pairs persist, so the classic delisting problem is milder. The people version is not milder at all, and broker symbol lists, prop firm rulebooks and your own saved strategies all change over time in ways that remove the failures.
How do I remove survivorship bias from my own testing?
Use data that includes instruments which stopped trading, keep every strategy you have retired along with the reason, and when you cannot do either, write down that the result is an upper bound rather than an estimate.
If most visible track records are unreliable, how do I ever judge anyone?
By process rather than outcome. Ask for the denominator, ask what the losing periods looked like, and ask whether the reasoning was written down before the trade or after it. Someone who kept their bad months on the record is giving you a far more useful sample than someone showing only good ones.
Does a long track record solve the problem?
It helps, and the table above says how much. A small edge needs thousands of trades before it can be distinguished from the shape of the filter, so length matters more than most people assume, and a strong result over a short record should raise questions rather than settle them.
Where REX fits
REX Trading Signal is a free channel about running a trading account the way you would run a small business, with a risk ceiling, a cost line and a review you actually do. There is nothing sold on a promise of returns here. The free business plan template is one page, and its job is to make you write down the limits before the market asks you about them. The piece everything else hangs off is the one page trading business plan template.
About the author. Rex writes REX Trading Signal. He spent two years keeping only the strategies that worked and throwing the rest away, then realised he had destroyed the only evidence that could have told him whether any of them were any good. The archive has been complete ever since.
This article is educational and is not financial advice. Trading gold and other leveraged products carries a high risk of losing money rapidly, and no entry, stop or target discussed should be treated as a signal. The survival rates, survivor averages and t statistics are exact dynamic programming results for a random walk with an absorbing barrier, on the assumptions stated in the text, and they describe a constructed cohort rather than any real group of traders. The regulatory quotations are from 17 CFR 4.41 and FINRA Rule 2210 as linked above. The two academic papers are cited by title and journal only. Reader quotations are real messages, anonymised and lightly edited, and the inbox count is a keyword count rather than a survey. Decide your own risk, and never trade money you cannot afford to lose.