
What is look ahead bias in backtesting? It is information from the future leaking backwards into a decision your past self could not have made. In accounting terms it is the same offence as booking January's revenue into December: the totals still add up, every formula still works, and the picture is a lie.
I care about this because a backtest is a forecast, and a business that acts on a forecast it has not audited is a business making decisions with a number it does not understand. The uncomfortable part is that look ahead bias does not announce itself. The code runs. The equity curve goes up. Nothing errors. You only find it if you go looking.
So I went looking, with a simulation where I know the right answer in advance, because the data has no edge in it at all. Every figure below comes from that simulation and I have published the assumptions so you can disagree with them.
What is look ahead bias in backtesting, in business terms
Think of your strategy as a decision made at a point in time by a person with a specific set of facts on their desk. At the close of Tuesday, they know Tuesday's close and everything before it. They do not know Wednesday. They do not know the average of the whole year. They do not know which of the forty variations you will eventually test turned out best.
Look ahead bias is any case where your backtest quietly hands that person a fact they could not have had. It comes in three sizes.
The crude version uses tomorrow's price to decide today's trade. Obvious when you look, easy to write by accident when your data is in a spreadsheet and a row reference is off by one.
The plausible version is a timing mismatch. The signal is computed from the closing price, and the backtest fills the order at a price from that same bar. Every line of code looks defensible on its own. This is the one that ruins people, because the result it produces is believable.
The structural version is not a bug at all. It is choosing which strategy to believe in after seeing how all the candidates performed on the data you are testing on. Nothing leaked into any single backtest. The leak is in the selection.
The experiment, and the rules of it
I generated 5,040 daily bars, which is 20 trading years at 252 bars a year. Returns are drawn independently from a normal distribution with a mean of zero and a standard deviation of 1.0 per cent per bar. The seed is 20261010, so this is reproducible.
The crucial property: there is no edge in this data. None. It is noise with no memory and no drift. Any strategy that appears to work on it is, by construction, wrong.
The rule under test is deliberately dull. Take the sum of the last 20 returns. If positive, go long for one bar. If negative, go short for one bar. Always in the market, full size.
Two further assumptions, both generous. No spread, no commission, no slippage and no financing cost. And no position sizing, so nothing compounds inside a bar. A real account pays all four of those costs, which means every figure below flatters the strategy relative to reality.
What the three backtests reported
Same rule. Same price series. Three ways of wiring up the test.
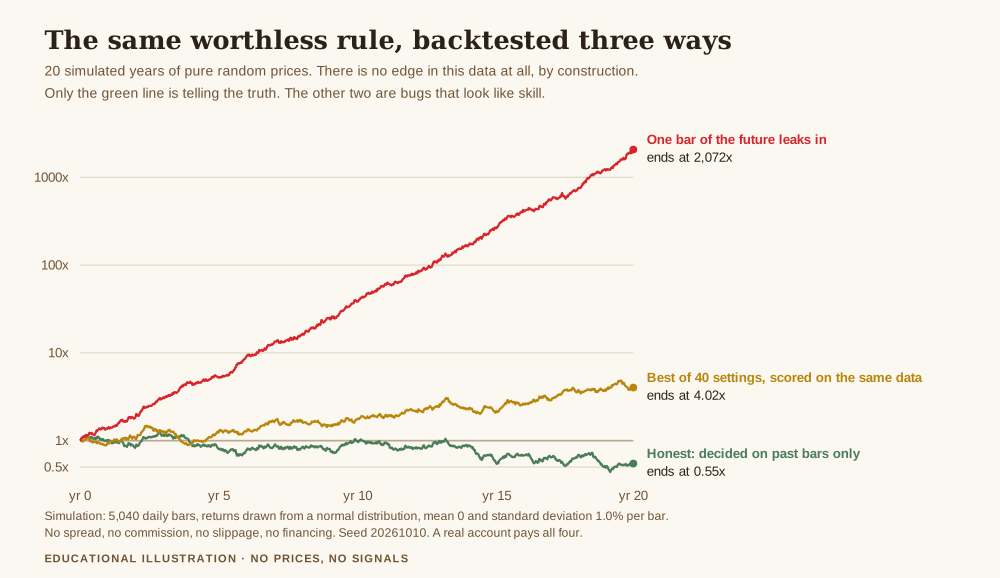
The honest version. Decide at the close of bar t using only bars up to t, take the return of bar t+1. Over 20 years the account ends at 0.55 times where it started, a total return of -45.2 per cent, or -2.97 per cent a year. The share of profitable bars is 49.4 per cent, which is what you would expect from a coin. This is the correct answer: no edge, and a slow bleed from the mathematics of compounding a volatile return stream around zero.
One bar of leaked future. Let the position be chosen knowing the return of the very bar it will be held through. The account ends at roughly 127 quadrillion times its starting value, an annualised 622 per cent, with 100 per cent of bars profitable.
That second result is useless as a strategy and extremely useful as a diagnostic. Nothing real produces a perfect record over 5,020 decisions. If a backtest ever shows you a figure in that neighbourhood, you have not discovered anything, you have found a bug, and you should go and find it rather than celebrating.
The dangerous one is not the obvious one
Now the third wiring, and this is the heart of it.
The signal is computed properly from data up to the close of bar t. But the backtest credits the strategy with bar t's own return, as though the position had been opened at that bar's open. You can arrive here by assuming you were filled at the open of the day whose close generated your signal. It is a one line mistake in the execution logic, and the signal code is innocent.
Result: the account ends at 2,072 times its starting value. An annualised return of 46.72 per cent. A Sharpe ratio of 2.55. The share of profitable bars is 56.2 per cent, which is modest enough to look real.
Read those numbers as if a colleague brought them to you. A Sharpe of 2.55 is excellent but not impossible. A 56 per cent hit rate is the sort of thing an honest system reports. Forty six per cent a year is the kind of figure a serious person might believe of a serious system. There is nothing in that result that screams bug, and all of it came from noise.
This is why I distrust my own backtests before I distrust anything else. The crude error produces a number so absurd it defends you. The plausible error produces a number you want to be true. For what the Sharpe ratio can and cannot tell you on its own, we went through that in risk adjusted return and the Sharpe ratio.
The cousin that no bug fix will catch
There is a fourth result, and it is the one I find hardest to defend against.
I took the honest wiring, with no leakage of any kind, and tested 40 different lookback lengths from 2 to 41 on the same 20 years. Then I did what everyone does: picked the one that performed best.
The winner was a 6 bar lookback. On that data it returned 301.9 per cent in total, an annualised 7.21 per cent, with a Sharpe of 0.52. That is not an outrageous number. It is exactly the sort of result that reads as a genuine, modest, believable edge. Of the 40 configurations tried, 11 of them, or 28 per cent, looked profitable, with Sharpe ratios spread from -0.25 to 0.52.
Then I ran that same 6 bar rule on a fresh series from the same noise generator. It returned -33.3 per cent, an annualised -2.01 per cent, Sharpe -0.05. The edge was gone, because it was never there. I had not found a strategy. I had found the luckiest of 40 lottery tickets and mistaken it for skill.
No bug caused that. Every individual backtest was clean. The selection was the leak.
This failure has been formally studied. Bailey, Borwein, López de Prado and Zhu set it out in Pseudo-Mathematics and Financial Charlatanism, in the Notices of the American Mathematical Society, volume 61, issue 5, 2014, page 458, DOI 10.1090/noti1105. Two findings from it are worth keeping. They prove that high simulated performance is easily achievable after testing only a modest number of configurations. And they find that under memory effects, backtest overfitting leads to negative expected returns out of sample, not merely zero. My -2.01 per cent a year is a small instance of exactly that.
They also point out the thing that makes this hard to police from the outside: analysts rarely report how many configurations they tried. Without that number, a Sharpe ratio is uninterpretable. A 0.52 from one attempt and a 0.52 from four hundred attempts are completely different claims, and they look identical on the page.
How this actually gets into your testing
In order of how often I have caught it, in my own work and in other people's.
Filling at a price the signal already used. The one above. If the signal needs a bar's close, the earliest honest fill is the next bar.
Indicators that recentre the whole series. Anything normalised by a mean, standard deviation or min and max computed over the entire dataset has put the end of your sample into the beginning of it. Rolling windows only.
Data that was revised after the fact. Economic releases get restated. If your file holds the final revised value, your backtest traded on a number nobody had on the day. This is why a result on fundamental data needs a point in time dataset or an honest disclaimer.
Instrument lists assembled today. Testing a basket chosen because those instruments are liquid now excludes everything that was delisted, which is survivorship bias, look ahead bias with a different hat on.
Rules written after reading the chart. The most common one and the hardest to see, because there is no code to inspect. If you added a filter because you remembered a bad period, the filter knows about that period. Your past self did not.
If you are testing an automated system specifically, the platform mechanics matter too, and we covered those in how to test an EA on MT5.
The operating rules I use
These are cheap, and together they catch most of it.
Write down the configuration count. Before you report any result, record how many variants you tried to get it. If the honest answer is forty, the result means much less than if the answer is one. This single number does more work than any statistical correction, and almost nobody records it.
Hold data back before you start, not after. Split the sample first, then do your work on the first part only. Data held back after you have already looked at everything is not held back.
Treat an excellent result as a fault report. Set a threshold in advance that means "investigate", not "deploy". Mine is roughly a Sharpe above 2 on daily bars. Above that I assume a bug until I have proved otherwise, and most of the time I have been right to.
Delay every signal by one bar and rerun. If the result collapses, the strategy was living on information it should not have had. A genuine edge degrades when you delay it. A leak disappears.
Add costs early. Spread, commission and slippage kill high frequency illusions quickly. A strategy that only works at zero cost is not a strategy, it is a rounding error with ambitions.
And the one that ties it to running the account as a business: write the forecast down before the test, not after. If you cannot say in advance what result would make you reject the idea, the test is not a test, it is a search for permission. The sheet I keep this on is the one page trading business plan, and the related question of when a live system has earned retirement is in when to retire a trading strategy.
Get the free REX one page business plan, the sheet that makes you write down what you expected and how many variations you tried before the result gets a vote. One email, no spam, unsubscribe anytime.
Get the free business plan →Frequently asked questions
What is look ahead bias in backtesting, in one sentence?
Using information in a simulated decision that would not have been available at the moment the decision was made, which makes the backtest report a result no real account could have achieved.
How do I know whether my own backtest has it?
Delay every signal by one full bar and run it again. If a strong result mostly survives, it is probably not leakage. If it collapses, the original was reading something it should not have seen. Then check the three usual suspects: the fill price relative to the signal bar, any indicator normalised over the full sample, and whether your data has been revised since the dates you are testing.
Does walk forward testing fix it?
It fixes the selection problem substantially, because parameters are chosen on one window and tested on the next. It does not fix a wiring error, which will leak identically inside every window. The two problems need two different checks, and passing one is not passing the other.
Is a Sharpe ratio of 2.55 realistic?
For a retail system on daily bars, treat it as a reason to audit rather than a reason to deploy. In the simulation above, that exact figure came from pure noise plus a one line execution error. Good systems exist, and they do not usually need you to believe something remarkable on the first pass.
If a backtest can be this misleading, why run one at all?
Because the alternative is finding out with real money. A backtest is poor at proving an edge exists and genuinely good at proving one does not. Used as a filter for rejecting ideas rather than a machine for endorsing them, it earns its place. The trouble starts when a rejection tool gets treated as a promise.
Where REX Trading Signal fits
REX Trading Signal is a free journal about running a trading account like a business, which mostly means writing the decision down before taking it instead of justifying it afterwards. Nothing here is sold on a promise of returns, and there is no signal service to subscribe to. The free one page business plan is the sheet that makes you state the expectation before the result arrives. The piece underneath all of it is the one page trading business plan, and the measure most often over trusted alongside a backtest is covered in what profit factor means.
About the author. Rex writes REX Trading Signal. He once spent a good week pleased with a backtest before discovering it was filling orders at a price the signal had already read, which cost him nothing except the week, and only because he had not yet funded it. He now treats a beautiful equity curve as a bug report.
Risk disclosure. This article is educational and is not financial advice. Trading gold and other leveraged products carries a high risk of losing money rapidly, and no entry, stop or target discussed should be treated as a signal. Every return, Sharpe ratio and equity multiple above is produced by simulation from the stated assumptions, with a fixed seed of 20261010, on synthetic random data that contains no edge by construction, excluding spread, commission, slippage and financing. These figures demonstrate how a backtest can mislead; none of them is achievable, and that is the entire point. No figure here comes from my own account or anybody else's. The academic reference is Bailey, Borwein, Lopez de Prado and Zhu, Notices of the American Mathematical Society, volume 61, issue 5, 2014, page 458, DOI 10.1090/noti1105, verified through Crossref. Decide your own risk, and never trade money you cannot afford to lose.