
Every trader who has ever tuned a setting and watched the equity curve improve has brushed against this, usually without naming it. So: what is overfitting in trading? It is what happens when you keep adjusting a rule until it fits the past beautifully, and in doing so fit it to things that will not happen again.
The reason it deserves a place in a business journal rather than a statistics one is that it is not an academic failure mode. It is a capital allocation decision made on a false reading, and the business pays for it twice: once in the months spent building the thing, and again in the money committed to it before the market gets a vote.
Rather than argue about it, I built a market with no edge in it at all and went looking for one anyway. Every number below comes out of that experiment, the code is described well enough to rebuild, and the random seed is written down so the results can be reproduced exactly.
What is overfitting in trading, in the regulator's own words
There is a definition sitting in US federal regulation, and it is sharper than most textbook ones.
Anybody presenting simulated or hypothetical performance to the public has to attach a prescribed warning. The text is set out in 17 CFR 4.41(b)(1)(i), and the sentence that matters reads: "Simulated or hypothetical trading programs in general are also subject to the fact that they are designed with the benefit of hindsight."
Designed with the benefit of hindsight. That is overfitting, described by a rulemaker who had seen enough of it to make the disclosure compulsory. The regulation adds that because the trades were never executed, the results "may have under-or over-compensated for the impact, if any, of certain market factors, such as lack of liquidity".
Note what the rule does not say. It does not say the backtest was dishonest or the arithmetic wrong. A perfectly honest backtest, computed correctly on real data, still carries this warning, because the problem is not in the computation. It is in the selection.
A market with nothing in it
Here is the experiment, stated so you can take it apart.
I generated 2,000 days of returns, about eight years, drawn from a normal distribution with a mean of exactly zero and a standard deviation of 1 per cent a day. There is no trend, no momentum, no mean reversion and no edge of any kind. There cannot be, because I built it that way.
Then I split it down the middle. The first 1,000 days are the backtest window. The last 1,000 days are held back and not consulted until the end, which is the discipline most strategy development skips.
The strategy is deliberately plain: be long tomorrow if the average return over the last n days is above a threshold t, otherwise stand aside. Two dials, nothing else. I tried 40 values of n and 25 values of t, which is 1,000 backtests. No commission, no spread and no slippage are charged, which flatters the results rather than penalising them. The random seed is 20261011.
Any trader would recognise the process. It is a parameter sweep, and it is what most strategy development actually consists of.
What 1,000 backtests found in a market that had nothing
The best of the 1,000 was a 16 day lookback with a threshold of plus 0.24 per cent a day. Over the backtest window it produced an annualised Sharpe ratio of 0.75.
That is not a spectacular number, and that is exactly why it is dangerous. A Sharpe of 0.75 on eight years of data does not look like a fluke. It looks like a modest, believable, fundable strategy. Plenty of real money has been allocated on less.
Carried into the 1,000 days it had never seen, the same rule returned 0.28.
The top ten rules averaged 0.50 in the backtest window and 0.13 out of it. And the average across all 1,000 backtests was negative, at minus 0.30, which is the honest baseline: in a market with no edge, the typical rule loses money to the mechanics of being in and out. Only the winners looked good, and they looked good because they were the winners.
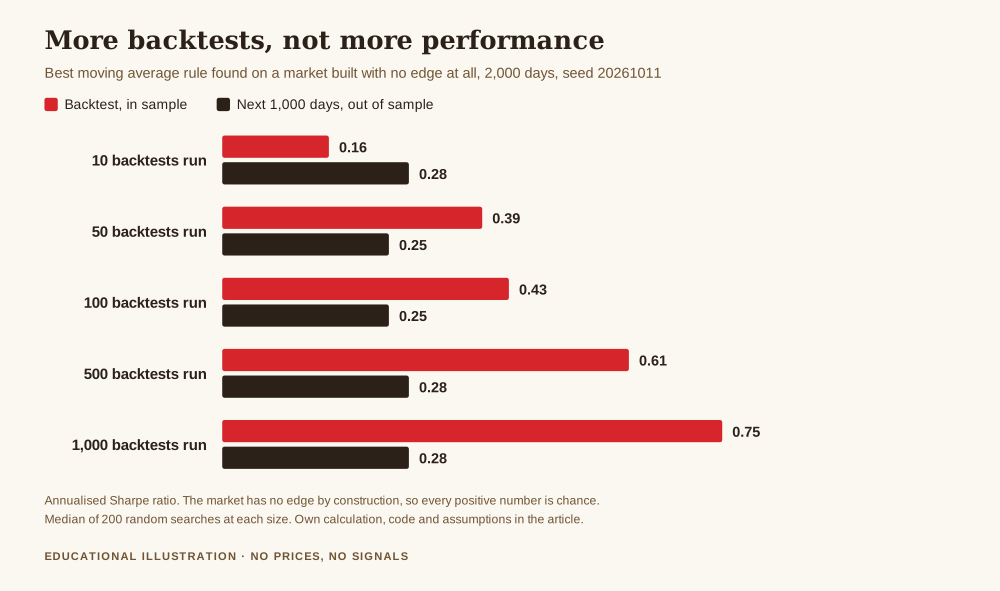
More searching buys more backtest, not more performance
The chart above is the finding I would put on the wall. To build it I drew random subsets of the 1,000 backtests, took the best one in each subset by its backtest result, and then looked at what that winner did out of sample. Two hundred repetitions at each search size, and the figures are medians.
Search ten rules and the best one shows 0.16. Search fifty and the best shows 0.39. A hundred, 0.43. Five hundred, 0.61. A thousand, 0.75.
The backtest number climbs steadily with the amount of searching, in a market that contains nothing to find. Meanwhile the out of sample column sits flat between 0.25 and 0.28 the entire way across, completely indifferent to how hard anyone looked.
That gap is the whole subject. The effort did not produce performance, it produced a better looking backtest, and those are different products.
One honest caveat, because it is the kind of thing I would want pointed out to me. The out of sample figures are not zero, they are around 0.25. That is not residual skill, it is the realised drift of that particular stretch of random numbers, which came out slightly positive by chance. It is worth stating because it is exactly the sort of number a motivated person would present as evidence the strategy survived.
Twenty more markets, in case the first was a fluke
A single run of an experiment proves very little, so I ran twenty more, each a fresh market with no edge in it, 260 backtests apiece.
The median best backtest across the twenty was a Sharpe of 0.70. The median out of sample result for those same winning rules was 0.08. And the winner stayed positive out of sample in 13 markets out of 20, which is a coin flip with a slight cough.
Every one of those twenty strategies would have passed the test most traders apply, which is "the backtest looks good". None of them had anything in them, because there was nothing to have.
Why it happens, and the arithmetic you can do in your head
The mechanism is not mysterious. Each backtest is a measurement with noise in it. Take the maximum of many noisy measurements and you have selected for the noise, because the largest value is the one where chance helped most.
Statisticians have a rough rule for how far out that maximum sits. The best of N pure noise results lands roughly the square root of twice the natural log of N standard errors above zero. Which gives:
Best of 10 trials: about 2.15 standard errors. Best of 100: 3.03. Best of 1,000: 3.72. Best of 10,000: 4.29.
Two things follow. First, even ten attempts buys a result that looks statistically respectable. Second, the growth is logarithmic, so grinding from a thousand attempts to ten thousand adds only about half a standard error of fake performance, while costing ten times the compute. The damage is done early, by the first few dozen tweaks, which is precisely the number a human does by hand.
This also explains why the problem is invisible from the inside. Nobody experiences it as cheating. It is experienced as a productive afternoon.
What it costs a trading business
A business judges this by cost, so let us.
The lost development time is the smallest line. The real cost is that the backtest number is the input to position sizing, to the capital allocated, and to how long you persist when it goes wrong. A strategy you believe has a Sharpe of 0.75 gets funded differently and defended longer than one you know is unproven. You will sit through a drawdown you should have cut, because the backtest told you to expect recovery.
And the second order cost is the one that compounds. Every overfitted strategy that fails teaches the wrong lesson. The conclusion drawn is almost always "the market changed" or "the edge decayed", because that feels more plausible than "there was never an edge and I selected noise". So the same process runs again on a new idea, and the business never learns the thing that would have saved it.
This is the same failure I described from a different angle in look ahead bias in backtesting. There the backtest knew something it could not have known at the time. Here it knows nothing it should not, it has simply been chosen from a crowd. Both end with a number that cannot be collected in the real world.
What actually reduces it
None of these make a backtest trustworthy on its own. Together they make it less of a liability.
Count your trials and write the number down. This is the single most useful habit, and almost nobody does it. The thirtieth variation you test is not the same evidence as the first, and if you do not know whether you are on attempt three or attempt three hundred, you cannot interpret the result at all.
Hold data back, and mean it. Split the sample, build on one part only, and look at the other once. The moment you go back and adjust after seeing the held back data, it has become part of the backtest and is no longer evidence of anything.
Prefer fewer dials. My toy had two and that was enough to manufacture a Sharpe of 0.75. A rule with six parameters is not six times more expressive, it is enormously more so, and every dial multiplies the number of trials you are implicitly running.
Treat a performance cliff as a warning. If 16 days works and 15 or 17 do not, you have found a feature of your sample, not of the market. Robust behaviour degrades gently around its settings.
Give it forward time before it gets size. Paper or minimum size for a defined period, measured against what the backtest predicted. Slow, and the only test that is not retrospective. The related question of when to stop trusting something that used to work is in when to retire a trading strategy, and the measurement framework sits in what profit factor actually means.
For whatever it is worth, there is a well known paper on this in the academic literature, by Bailey, Borwein, Lopez de Prado and Zhu, titled "Pseudo-Mathematics and Financial Charlatanism: The Effects of Backtest Overfitting on Out-of-Sample Performance", published in the Notices of the American Mathematical Society in May 2014, volume 61, issue 5. Its DOI is 10.1090/noti1105, which I verified through Crossref rather than from memory. I have not quoted any figure from inside it, because I could not open the full text to check one, and quoting a statistic you have not read is the same error in a different suit.
What this article does not say
It does not say backtesting is useless. A backtest is excellent at rejecting things. If a rule fails on its own history it is finished, and that is worth knowing cheaply. The asymmetry is the point: failure is informative, success is ambiguous.
It does not say a Sharpe of 0.75 is always noise. It says that number arose from noise in my experiment after a thousand attempts, and that you cannot tell the two apart from the number alone. What distinguishes them is how many things were tried to find it, which is why counting matters.
And the figures above describe a simulated market, not gold and not any instrument you trade. They are a demonstration of a selection effect, not a measurement of anything real, and nothing here is a view on where any price is going.
Get the free REX one page business plan, the sheet where a strategy gets written down with its assumptions before any capital is committed to it. One email, no spam, unsubscribe anytime.
Get the free business plan →Frequently asked questions
What is overfitting in trading, in one sentence?
Tuning a rule until it fits the past so closely that it has captured the accidents of that particular sample rather than anything repeatable, with the result that it performs far worse on data it has not seen.
How do I know if my strategy is overfitted?
There is no test that settles it, but three signs carry weight. You tried many variations and kept the best. Performance collapses when a parameter moves slightly. And the rule has more conditions than you can justify from how the market works. The single most informative fact is how many versions you tested, which is why that number is worth recording as you go.
Does more data fix overfitting?
It helps, because noise averages out over a longer sample, but it does not fix it. In the experiment above the backtest window was a thousand days and a Sharpe of 0.75 still appeared from nothing. What more data does is raise the number of trials needed to manufacture a given result. It does not change the direction of the effect.
Is overfitting the same as curve fitting?
In trading the two terms are used for the same thing. Curve fitting is the older phrase and tends to describe the act of tuning, while overfitting describes the state the result ends up in. The failure is identical.
Why is a small number of parameters safer?
Because each parameter multiplies the number of combinations you can try, and the number of trials is what drives the selection effect. Two dials produced a thousand backtests in this experiment. Four dials of similar range would produce a million, and the best of a million noise results sits noticeably further from the truth.
What is a realistic out of sample result?
Worse than the backtest, essentially always. The useful question is not whether it degrades but whether you decided in advance how much degradation would make you stop, and wrote that number down before seeing it.
Where REX Trading Signal fits
REX Trading Signal is a free journal about running a trading account like a business, which mostly means being honest about what you actually know before you commit money to it. Nothing here is sold on a promise of returns and there is no signal service to subscribe to. The free one page business plan is where a strategy and its assumptions get written down before any capital is allocated. The piece underneath all of it is the one page trading business plan, and the build process this article is a warning about is laid out in how to build a trading system.
About the author. Rex writes REX Trading Signal. He spent a winter improving a strategy from a Sharpe of 0.4 to 1.1 and only later worked out that he had run roughly two hundred variations to get there, which is about what pure chance pays for two hundred attempts. He now writes down the number of versions tried in the same file as the result.
Risk disclosure. This article is educational and is not financial advice. Trading gold and other leveraged products carries a high risk of losing money rapidly, and no entry, stop or target discussed should be treated as a signal. The definition of hindsight design and the prescribed disclosure language are quoted from 17 CFR 4.41(b)(1)(i) as published in the Electronic Code of Federal Regulations, and the cited paper's title, authors, journal and date were verified through the Crossref registry. All Sharpe ratios, search size figures and streak counts are my own simulation output on randomly generated data with a mean of exactly zero, seed 20261011, on the assumptions stated in the text, and they describe a simulated market rather than any traded instrument. Decide your own risk, and never trade money you cannot afford to lose.