
Someone asks what is risk adjusted return sharpe ratio and they are usually asking two questions at once. What is the formula, and is my number any good. The first has a clean answer. The second has an answer almost nobody wants to hear, which is that with twelve months of data your number is so uncertain that it barely constrains anything at all.
I want to do both properly, with the arithmetic shown, because this is a business metric and a business owner who cannot reproduce a metric should not be reporting it.
What Is Risk Adjusted Return Sharpe Ratio, in Business Terms
Every business has a return and a cost of producing it. In trading, one of the costs is volatility: the swing you had to sit through to collect the return. The Sharpe ratio is the ratio between the two. It asks how much excess return you earned per unit of the wobble you endured getting it.
The formula is three terms. Take your average return over a period. Subtract the return you could have had for no risk at all. Divide by the standard deviation of your returns.
The measure comes from William F. Sharpe, and the paper worth citing is not the original 1966 one but his 1994 revision, "The Sharpe Ratio", Journal of Portfolio Management, volume 21, issue 1, pages 49 to 58, DOI 10.3905/jpm.1994.409501. That paper is where he restates the ratio in terms of a differential return, which is the version everyone now uses, and where he is notably careful about how much confidence a short sample deserves. He was right to be. I checked that DOI against the Crossref record rather than quoting it from memory, which is a habit worth copying, because a citation nobody verified is just a decoration.
The Risk Free Rate, and Where to Get It Without Guessing
The middle term trips people up because they invent it. Do not. It is published.
The Federal Reserve's H.15 release of selected interest rates carries it daily. In the release dated 23 September 2026, the three month Treasury bill on the secondary market was quoted at 4.01 per cent per annum for 22 September 2026. That is the number I will use throughout, which works out at 0.33417 per cent per month.
Use whatever the current published figure is when you run your own, and read the release's notes on how each rate is quoted once, because Treasury bills on the secondary market are quoted on a discount basis and constant maturity yields are not the same series. The point is that this term is a fact you look up, not a parameter you choose.
Two Businesses, Same Return, Different Answer
Here is the whole idea in one worked example. Two accounts, both averaging 1.20 per cent per month over twelve months. Identical average. The only difference is how bumpy the road was.
- The steady one, monthly standard deviation 1.0 per cent. Monthly Sharpe of 0.8658, which annualises to 3.00.
- The middling one, monthly standard deviation 2.0 per cent. Monthly Sharpe of 0.4329, annualising to 1.50.
- The rough one, monthly standard deviation 3.6 per cent. Monthly Sharpe of 0.2405, annualising to 0.83.
Annualising is the step people get wrong, so here it is explicitly. You multiply the monthly Sharpe by the square root of 12, not by 12. Returns add with time, but standard deviation grows with the square root of time, so the ratio between them grows with the square root too. Multiply by 12 and you will report a number roughly three and a half times too flattering, which happens more often than you would think.
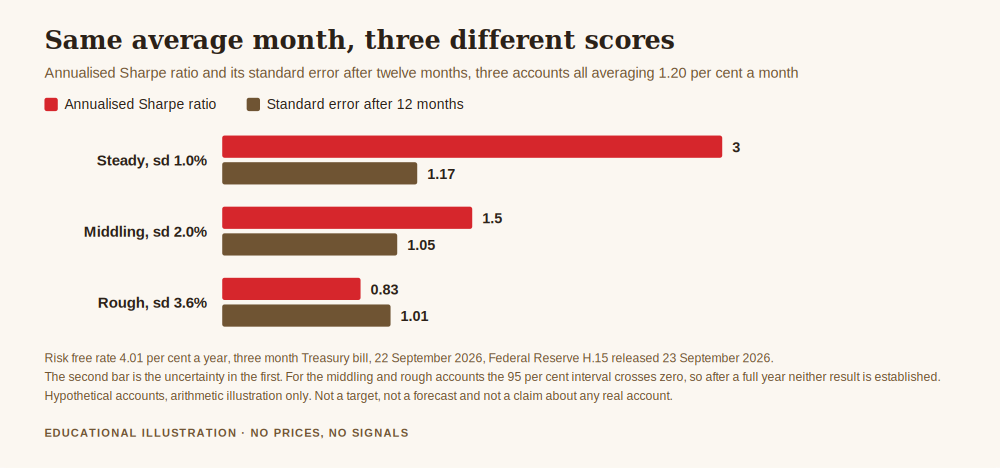
Three businesses with the same revenue line. One of them is three and a half times better at producing it. A profit and loss statement on its own could never tell you that, which is the entire reason the metric exists.
The Part That Should Change How You Use the Number
Now the uncomfortable half. A Sharpe ratio computed from twelve months is an estimate, and estimates have error bars. The standard error of an estimated Sharpe ratio is approximately the square root of one plus half the squared Sharpe, all divided by the number of observations, computed in the same periodicity and then annualised alongside it.
Run that on the three accounts above, each with twelve monthly observations:
- The steady one: annualised Sharpe 3.00, standard error 1.17, and a 95 per cent interval running from 0.70 to 5.30.
- The middling one: annualised Sharpe 1.50, standard error 1.05, interval from minus 0.55 to 3.55.
- The rough one: annualised Sharpe 0.83, standard error 1.01, interval from minus 1.16 to 2.82.
Look at the second and third lines. Both intervals cross zero. After a full year of trading, neither account has produced enough evidence to establish that its risk adjusted return is positive at all. Not that it is bad. That it is unestablished, which is a different and more honest statement.
And look at the first line. The best of the three reports a headline 3.00 and the honest reading is "somewhere between 0.70 and 5.30", which spans the gap between ordinary and exceptional.
How long until it tightens? To get the standard error on the annualised figure below 0.50 for even the steadiest of the three, you need 66 months of data. Five and a half years. That is not a discouraging fact, it is a planning fact, and a business owner would rather know it now than discover it after rebuilding a process around a number that was noise.
Get the free REX one page trading business plan, including the short list of numbers worth tracking monthly and the space to write down how long each one needs before you act on it. One email, no spam, unsubscribe anytime.
Get the free business plan →Why Volatility Is a Real Cost, Not an Inconvenience
There is a second reason a business should care about the denominator, and it is not psychological. Volatility costs money directly.
Compounding runs on the geometric average, not the arithmetic one, and the approximation is that expected growth equals the average return minus half the variance. On the same three accounts, all of which averaged 1.20 per cent per month:
- The steady one keeps an expected 1.1950 per cent per month.
- The middling one, 1.1800 per cent.
- The rough one, 1.1352 per cent.
Compounded across twelve months, the gap between the steadiest and the roughest is about 0.81 percentage points of annual growth, handed over for nothing. Same average month, less money at the end, purely because of the shape of the path. These are arithmetic illustrations on an assumed monthly average, not a target and not a claim about what any account will do.
So when the Sharpe ratio penalises volatility, it is not being fussy on your behalf. It is pricing something that genuinely takes money out of the business.
What the Ratio Does Not Tell You
Four limits, and a business owner should know all four before putting the number in a report.
It treats upside and downside volatility identically. A month where you made an unusually large gain damages your Sharpe ratio exactly as much as a month where you lost the same amount. If that offends you, the answer is a different denominator rather than a different attitude, and the choice of denominator is covered in what is a good risk adjusted return.
It assumes returns behave reasonably. Trading returns tend to have fat tails, which means the occasional result far outside what the standard deviation implies. A strategy that quietly sells insurance against rare events will post a beautiful Sharpe ratio right up until the event arrives.
It is trivially inflated by measuring less often. Compute it from monthly figures and your daily wobble disappears into the averaging. Compute it from daily figures and the same strategy scores lower. Both are correct. Neither is comparable to the other, so state your periodicity whenever you report a number.
And it says nothing about the worst moment. Two accounts with the same Sharpe ratio can have very different maximum drawdowns, and it is drawdown, not standard deviation, that decides whether you were still trading in month nine. That is why the ratio belongs beside the other numbers in the metrics a trading business should track rather than above them.
How to Actually Compute Yours
Five steps, none of them requiring anything beyond a spreadsheet.
Record your account equity on the same day each month. Turn those into monthly percentage returns. Take the average and the standard deviation of that column. Look up the current three month Treasury bill rate on the H.15 release and divide it by twelve. Then subtract, divide, and multiply by the square root of twelve.
Then write the sample size next to it. Always. "Sharpe 1.4 over 14 months" is a sentence a business owner can act on. "Sharpe 1.4" on its own is a number pretending to be a fact, and the whole point of running the account like a business is to stop doing that, which is the same discipline behind calculating consistency properly.
Frequently Asked Questions
What is risk adjusted return sharpe ratio, in one sentence?
It is your average return, minus the risk free rate, divided by the standard deviation of your returns. It measures how much excess return you earned for each unit of volatility you had to sit through, which lets you compare two accounts that made the same money by very different roads.
What counts as a good Sharpe ratio for a trading account?
Less than the number itself, the sample behind it. On the worked example above, an account scoring 3.00 from twelve months has a 95 per cent interval running from 0.70 to 5.30, so the headline figure is nearly uninformative. Treat anything computed from under two years as provisional, and compare only against numbers measured at the same frequency.
How do I annualise a monthly Sharpe ratio?
Multiply by the square root of 12, which is about 3.464. Not by 12. Returns scale with time while standard deviation scales with the square root of time, so the ratio scales with the square root. Multiplying by 12 overstates the result by a factor of about 3.46.
Which risk free rate should I use?
A published short term government rate covering the same period as your returns. The Federal Reserve H.15 release quoted the three month Treasury bill at 4.01 per cent per annum for 22 September 2026, which is 0.33417 per cent per month. Look up the current figure rather than carrying an old one forward, because the term is not a matter of preference.
Where did the numbers in this article come from?
Arithmetic on stated assumptions, computed rather than recalled: two hypothetical accounts averaging 1.20 per cent per month over twelve months with monthly standard deviations of 1.0, 2.0 and 3.6 per cent, and a risk free rate of 4.01 per cent per annum from the Federal Reserve H.15 release dated 23 September 2026. The standard error uses the usual large sample approximation. The Sharpe ratio definition follows Sharpe's 1994 paper, linked above and verified through Crossref. None of it is a forecast or a target.
Where REX Trading Fits
REX Trading Signal is free to follow. The daily record goes up with the reasoning stated before the outcome is known, losing days included, because a business keeps the whole ledger. There is a free one page business plan for anyone who wants to write their process down, and an optional Kit for people who want the full system. Nothing here promises a profit and nothing here is a signal service. If you are building the reporting side of your account, read what is a good risk adjusted return for the choice of denominator, what is a good expectancy ratio for the return side, and keep the one page trading business plan template open while you set it up.
A return on its own is half a sentence. The Sharpe ratio finishes it, and the sample size tells you whether the sentence means anything yet.
About the author. Rex writes REX Trading. He came to this from running an actual business, where a good quarter was never allowed to be reported without the number of weeks it was measured over. Nothing in this article is a recommendation to trade, and no entry, stop or target discussed should be treated as a signal.