
What is a good risk adjusted return is the question a business owner asks and a gambler does not. The gambler asks what the return was. The owner asks what it cost to get, because a business that made 30 percent by nearly going under twice is not the same business as one that made 30 percent quietly, and only one of them can be repeated on purpose.
The trouble is that almost nobody puts a number on the second half. So I did. I scored an asset anybody can look up, then simulated two traders with an identical edge and a different bet size to show what the raw return figure hides. The gap between them is large enough that a return quoted without its denominator is not a weak number, it is not a number at all.
What Is a Good Risk Adjusted Return, in Business Terms
A risk adjusted return is a result divided by what was risked to produce it. That is the whole idea. Any business that borrows or exposes capital does the same thing: revenue on its own means nothing until you know how much was tied up and how close the company came to running out of cash.
The reason it matters more in this business than in most is that here the numerator is easy to inflate. Doubling your bet size roughly doubles your expected return and does considerably worse than double to your worst month. Nobody has to lie for a headline return to be misleading. They just have to quote it alone.
There is no single good number, and any article that gives you one is selling something. What there is instead is a method, two sensible denominators and a way of comparing like with like.
The Two Denominators Worth Keeping
Return per unit of volatility. Take the annual return, subtract what cash would have paid you for doing nothing, and divide by the year's standard deviation of returns. This is the family the Sharpe ratio belongs to. It answers: how much return did each unit of bumpiness buy? Its weakness is that it treats upside jumps as risk, which they are not, to you.
Return per unit of drawdown. Take the annual return and divide by the worst peak to trough fall during the year. This one is closer to how the business actually feels, because drawdown is the number that decides whether you keep trading and whether anyone else keeps backing you. Its weakness is that it depends on a single worst episode, so it moves around a lot from year to year.
Use both. When they disagree, the disagreement is telling you something about the shape of the results rather than about which one is right.
Score Something You Can Look Up First
Before scoring an account, it helps to score something public, so that the method is checkable and the number has some context around it.
I took the published LBMA gold benchmark, afternoon fix, from 4 January 2016 to 14 August 2026, which is 2,663 sessions and 10.61 years, and treated it as a business: buy at the start, hold, no leverage, no costs. For the cash rate I used the three month Treasury constant maturity from the Federal Reserve's H.15 release, averaged over exactly the same days.
The result. Total return over the period was 305.70 percent, which annualises to 14.11 percent. Annualised volatility was 16.05 percent. The worst peak to trough fall was 26.11 percent, from 29 January 2026 to 16 July 2026. The average cash rate over the same days was 2.33 percent.
Now divide. Return per unit of volatility comes out at 0.734. Return per unit of drawdown comes out at 0.540. Those two numbers describe the same decade as the headline 14.11 percent, and they describe it far more usefully, because they tell you the 14.11 percent came attached to a period where a quarter of the position's value disappeared and did not come back for months.
One Year Is Not Enough to Judge Anything
The same measurements taken over rolling one year windows, 2,411 of them, show why a single annual figure is such a poor basis for a verdict. The median one year return was 10.65 percent, but the 5th percentile was minus 6.56 percent and the 95th was plus 48.05 percent. Return per unit of volatility ran from minus 0.706 to plus 2.795 with a median of 0.625. Return per unit of drawdown ran from minus 0.430 to plus 6.077 with a median of 0.984.
Same asset, same method, same decade. Depending on which twelve months you look at, the score is anywhere from clearly bad to spectacular. If that is the spread on a passive hold of a single metal, be very careful about what one year of your own results proves. The same lesson from a different angle sits in how to calculate consistency in trading.
Same Edge, Same Expected Return, Two Different Businesses
Here is the part that makes the denominator non negotiable. I simulated two traders who have exactly the same edge and differ in one respect only: how much they put on each trade.
Both have a 40 percent win rate where a win pays two units of risk and a loss costs one, an expectancy of plus 0.20 units per trade. Trader A risks 0.5 percent per trade and takes 252 trades a year. Trader B risks 2.0 percent per trade and takes 63. Their expected units of risk per year are identical by construction: 0.20 times 252 times 0.005 equals 0.20 times 63 times 0.020. On paper they are the same business. I ran a full trading year 100,000 times for each.
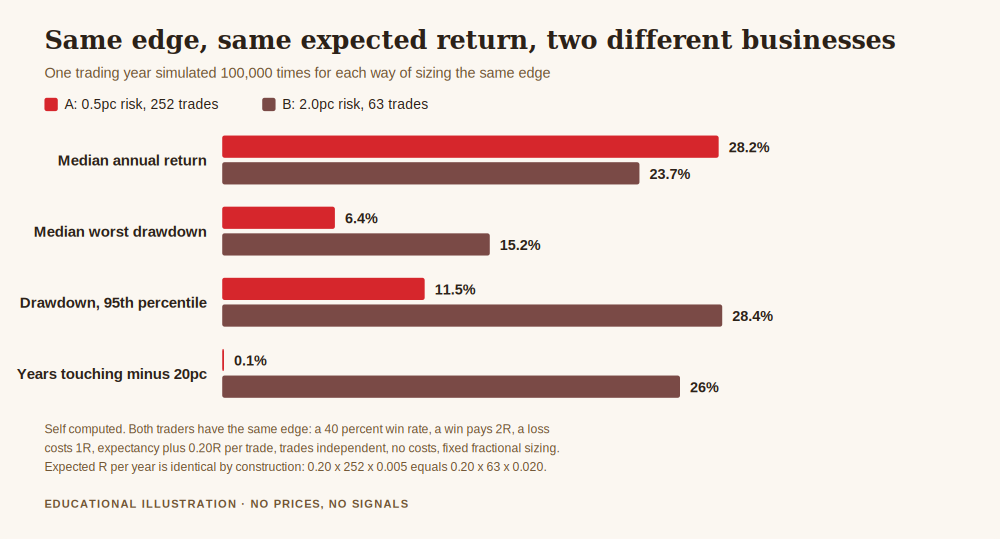
Trader A: median annual return 28.16 percent, 5th to 95th percentile from plus 5.50 to plus 55.68 percent, median worst drawdown 6.42 percent, 95th percentile drawdown 11.53 percent. Years ending at a loss: 1.67 percent. Years touching minus 20 percent: 0.05 percent.
Trader B: median annual return 23.72 percent, 5th to 95th percentile from minus 13.39 to plus 87.53 percent, median worst drawdown 15.23 percent, 95th percentile drawdown 28.39 percent. Years ending at a loss: 17.25 percent. Years touching minus 20 percent: 25.97 percent. Years touching minus 30 percent: 3.55 percent.
Put those side by side. The headline returns are within about four and a half points of each other, close enough that in any year either could be quoted as the better result. The drawdowns are not close at all, and neither is the chance of a losing year: 1.67 percent against 17.25 percent, a factor of ten. Return per unit of drawdown at the medians is 4.386 for A and 1.558 for B.
One of those is a business you can run for a decade. The other is a business where roughly one year in four goes 20 percent underwater, which is where financing gets pulled, plans get abandoned and people quit at the worst possible moment. The trading is identical.
The Detail Almost Everyone Gets Backwards
Look again at the median returns. Trader B, who bets four times bigger, has the lower median: 23.72 percent against 28.16 percent. Their expected units of risk are identical, so this is not a difference in edge.
It is compounding. Losses take a larger bite out of a smaller base than the same sized gains add back, and the bigger the swings, the more of the average return that effect quietly eats. The bigger bettor gets a wider distribution, a fatter right tail, and a lower middle. The 95th percentile outcome for B is plus 87.53 percent, which is why the approach sells itself. The median is worse and the floor is far worse.
That is the strongest argument for the denominator I know. It is not merely that risk adjusted return is a fairer measure. It is that ignoring risk adjustment leads to a bet size that lowers the result you are most likely to get.
So What Number Is Actually Good
Three honest reference points, in the order I would use them.
Against doing nothing. Cash paid 2.33 percent a year on average over this sample, with no drawdown at all. A return per unit of volatility near zero means the risk you took was not paid for. That is the floor, and it is a lower bar than most people expect.
Against the simplest alternative. Holding the metal scored 0.734 on volatility and 0.540 on drawdown over the decade. Any active approach in this instrument is competing with that, and it should be measured against it rather than against zero.
Against your own record. This is the one that matters. Compute the two ratios for each of your own quarters and years and watch what happens to them as you change things. If a change raises the return and raises the drawdown proportionally, you have not improved the business, you have resized it. Resizing is a decision anyone can make in ten seconds and it deserves none of the credit.
What I would not do is chase a published threshold. Numbers like "a Sharpe above 1 is good" come from institutional contexts with different constraints, cost structures and holding periods, and they are computed over far more data than a retail account ever produces. On the rolling windows above, a passive gold hold cleared 2.795 in its best year and minus 0.706 in its worst, which should end any temptation to treat one year's ratio as a grade.
Putting It in the Books
Practically, this is three lines added to a monthly review and nothing more.
Record the period return. Record the worst peak to trough fall inside the period, measured on the equity curve rather than on closed trades, because open losses are real losses. Divide the first by the second. Keep the standard deviation of your monthly returns alongside, and once you have twelve of them, divide the annual return above cash by the annualised standard deviation.
Then compare only like periods, and never let a change in size masquerade as an improvement in method. The key metrics every trading business should track is where these two belong, your monthly profit and loss review is the meeting where they get read out, and position sizing for gold trading is the lever that moves them.
Get the free REX one page business plan, the sheet where your risk per trade and the drawdown you are willing to fund sit on the same page, so a result always arrives with the denominator attached. One email, no spam, unsubscribe anytime.
Get the free business plan →Frequently Asked Questions
What is a good risk adjusted return for a retail trader?
There is no threshold worth quoting, and that is the honest answer rather than a dodge. The useful comparisons are the cash rate, the simplest passive alternative in the same instrument, and your own previous periods. For scale, a passive gold hold over the last decade scored 0.734 on return per unit of volatility and 0.540 on return per unit of drawdown.
Is the Sharpe ratio the best measure?
It is the most widely understood, which has real value when you need to be compared to something. It penalises upside volatility as if it were risk, and it needs a lot of data to be stable. For a trading account I would read it next to return per unit of drawdown rather than instead of it.
Why does a bigger position size lower my median return?
Because gains and losses compound on a moving base. A loss of a given size removes more than the same sized gain adds back, and that gap widens with the size of the swings. In the simulation above, the trader risking four times as much had the same expected units of risk and a median return 4.44 points lower.
Should I use maximum drawdown or standard deviation?
Both, for different questions. Standard deviation describes the ordinary texture of the results. Maximum drawdown describes the worst moment, which is the one that ends businesses. If you only ever track one, track the drawdown, since it is the number that predicts whether you will still be trading next year.
How long before my own risk adjusted return means anything?
Longer than feels reasonable. The rolling windows above show a single asset's one year score ranging from minus 0.706 to plus 2.795 depending only on which twelve months you picked. A trading account with fewer observations and changing behaviour is noisier still, so treat one year as a data point and not a verdict.
Does a high risk adjusted return prove I have an edge?
Not on its own, and not over a short record. It proves the results you have were efficient relative to the risk you took over that period. Whether that repeats is a separate question that only more observations can answer.
What These Numbers Do Not Say
The two simulated traders are models, not people and not forecasts. They assume an edge that stays constant, trades that are independent of each other, no costs, no financing and no slippage, and a win rate that holds through every market condition. Real accounts have none of those properties, and adding any of the missing ones makes both traders worse, the bigger bettor considerably more so. Nothing above is a claim that a 28 percent or a 23 percent annual return is achievable, expected or on offer here. The comparison between the two is the point. The levels are an artefact of assumptions I chose and stated.
The gold figures are a measurement of what one public benchmark did over one particular decade, with no costs and no leverage subtracted. They are context for a method, not a projection of anything.
Where This Leaves You
A return is half a sentence. Finish it before you judge it, and insist that anyone quoting one at you finishes it too.
The version of this I would take into next month is short. Every result gets a denominator. Comparisons happen between periods of the same length. And when the two ratios go up together while the raw return stays flat, that is the month something in the business genuinely improved, which is worth far more than the month the number was big. The framework it all hangs on is the one page trading business plan template, and treat trading like a business is where the habit starts.
About the author. Rex writes REX Trading Signal, where a trading account is treated as a small business with costs, capacity limits and a set of books. He is more interested in the constraint that ends the quarter than in the trade that started it.
Disclaimer: This article is general educational content about measuring results against the risk taken to produce them. It is not financial advice, not a recommendation to buy or sell gold or any other instrument, and not a suggestion to open any particular position. Trading gold, CFDs and leveraged products carries a high risk of losing money rapidly. No entry, stop or target discussed should be treated as a signal. The gold figures were computed by me from the published LBMA gold benchmark, afternoon fix, across 2,663 published sessions from 4 January 2016 to 14 August 2026, with the cash rate taken as the three month Treasury constant maturity from the Federal Reserve H.15 release averaged over the same days, assuming no leverage, no dealing costs and no taxes. The two trader comparisons are outputs of a Monte Carlo simulation I wrote, 100,000 simulated years per configuration, under the stated assumptions of a 40 percent win rate at a two to one payoff, expectancy of plus 0.20 units of risk per trade, fixed fractional sizing, independent trades and no costs. They describe a model, not any real account and not any real trader's results, and they are not a target, a projection or a promise. Past behaviour of a public benchmark is not a prediction.