
Ask a room of traders what is a good expectancy ratio in trading and you will get a number back within seconds. Usually 0.2R, sometimes 0.3R, occasionally something confident about a positive figure being all that matters. Every one of those answers has skipped the two questions that decide whether a figure is good, and a business owner would have asked both before quoting anything.
The first is: good enough to cover what? An expectancy is revenue per unit of risk, and revenue is only good relative to a cost base. The second is harder and gets skipped almost universally: how many trades produced that figure? Because an expectancy measured on a short record is not a small edge, it is a number with no information in it.
Both questions have arithmetic attached. Here it is, in units of account rather than any currency, with no gold price anywhere in this article.
What Is a Good Expectancy Ratio in Trading: The Formula First
Expectancy is what you expect to make per trade, expressed in R, where 1R is the money you put at risk on a single trade. If your losses are full stop outs, so a loss costs exactly 1R, the formula is one line.
E = (win rate × average win in R) − (loss rate × 1R)
An expectancy of 0.15R means that across a large number of trades, each trade returned an average of fifteen percent of the money it risked. It does not mean any individual trade did that. Most trades return either a full loss or a multiple of R, and the average is a property of the collection rather than of any member of it.
Run the formula across a grid and the shape of the problem appears. These are exact, not estimates.
At a 2R average win: a 30 percent win rate gives −0.100R, 35 percent gives +0.050R, 40 percent gives +0.200R, 50 percent gives +0.500R.
At a 1.5R average win: 40 percent is exactly break even at 0.000R, 45 percent gives +0.125R, 55 percent gives +0.375R.
At a 1R average win: you need better than a 50 percent win rate to clear zero at all, and 55 percent only reaches +0.100R.
Notice what that grid does not contain: a threshold. Nothing in the arithmetic says 0.2R is good and 0.1R is not. The formula produces a number, and the number is meaningless until you put it next to something.
Good Enough to Cover What? The Break Even Nobody Computes
A business does not ask whether its margin is positive. It asks whether its margin clears its fixed costs. Expectancy is the margin. Here is the same question asked properly, with every assumption stated so you can substitute your own.
Assumptions: an account of 25,000 units of account, risk of one percent per trade so 1R is 250 units, a fixed monthly running cost of 250 units covering data, platform, a VPS and bookkeeping, and 30 trades a month.
The expectancy that pays the running costs and nothing else is the monthly cost divided by the monthly risk turnover:
250 / (30 × 250) = 0.0333R per trade
So on that cost base, an expectancy below 0.0333R means the desk is running at a loss even while the trading looks positive. That is the number the grid above cannot give you, because it depends entirely on your costs and your trade frequency, and it is different for every operator reading this.
Push the same assumptions across a range and the sensitivity is stark. At 0.03R the desk gross 225 units a month and finishes 25 units down after costs. At 0.05R it grosses 375 and clears 125. At 0.10R it grosses 750 and clears 500. At 0.15R it grosses 1,125 and clears 875.
Read those carefully, because they are conditional arithmetic and not a forecast. They say what the money would be if the expectancy held at that level across those trades. Whether it holds is the second question, and it is where most of these calculations quietly fall apart.
The Question Nobody Asks: How Many Trades Before It Is Real?
Expectancy is an average drawn from a sample, and every average from a sample carries an uncertainty that shrinks with the size of the sample. The uncertainty on a trading record is large, because individual trade outcomes are spread widely around their mean.
Take a per trade standard deviation of 1.2R, which is unremarkable for a mixed book with full stop outs and a right tail on the wins. To say an expectancy is distinguishable from zero at 95 percent confidence, you need roughly n = (1.96 × 1.2 / E) squared trades.
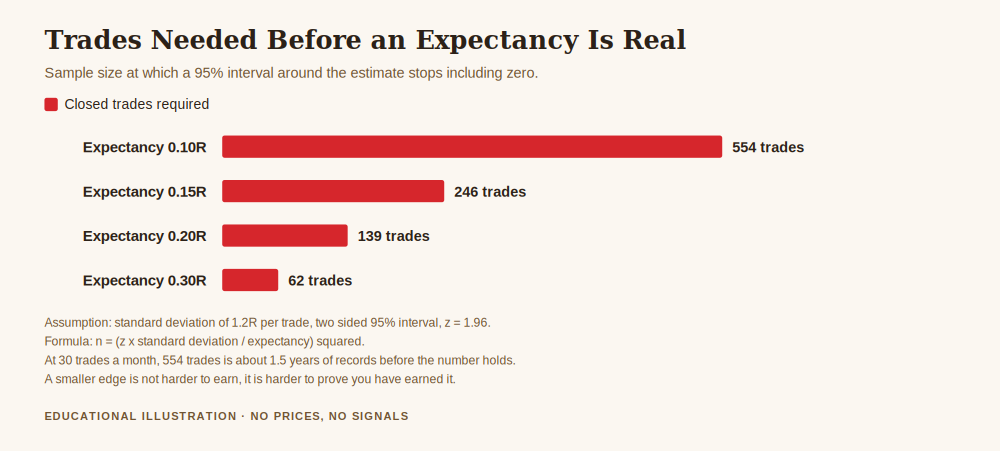
An expectancy of 0.30R needs 62 trades. At 0.20R it is 139. At 0.15R it is 246. At 0.10R it is 554, which at 30 trades a month is about a year and a half of records before the figure holds up.
Turn that around and look at what a short record actually tells you. Measure 0.15R over 40 trades and the 95 percent interval runs from −0.222R to +0.522R. That interval contains zero comfortably, and it also contains a losing system. Over 100 trades the same measured 0.15R gives −0.085R to +0.385R, still including zero. Only at around 250 trades does the interval finally clear zero, at +0.001R to +0.299R.
This is the sentence worth taking away: a trader reporting 0.15R after 40 trades has not measured a small edge. They have measured nothing, and the number they are quoting is as consistent with a losing system as with a working one.
Get the free REX one page business plan, the sheet where the cost base and the review date get written down while you are calm, so a good month cannot quietly promote a number that has not been earned yet. One email, no spam, unsubscribe anytime.
Get the free business plan →So What Counts as Good?
Putting the two halves together gives an answer that is useful precisely because it is not a single number.
An expectancy is good when it clears your cost base with enough room that the uncertainty around it does not change the sign. That is the whole test, and it has three inputs, only one of which is the expectancy itself.
Which means a 0.05R expectancy can be perfectly good for an operator with almost no fixed costs and 200 trades a month, and a 0.25R expectancy can be inadequate for one carrying heavy costs on 8 trades a month. The ratio in isolation ranks nothing. This is the same reason a good risk adjusted return cannot be quoted as a bare figure either.
Three things follow for the way you run the desk.
Compute your own break even expectancy first. Monthly fixed costs divided by monthly trades divided by 1R. It takes two minutes and it converts an abstract statistic into a threshold that means something for your operation. The fixed and variable costs of a trading business is where that cost figure gets assembled honestly, including the ones people forget.
Report expectancy with its sample size attached, always. "0.14R over 312 trades" is a measurement. "0.14R" on its own is a claim. Get in the habit of writing the second number next to the first in your own records, because you are the person most likely to be misled by leaving it off.
Do not re-decide the system on a sample too small to have spoken. The uncertainty above cuts both ways. If 40 trades cannot prove an edge exists, 40 trades cannot prove it has stopped working either. Set the review date and the sample size in advance, in writing, which is exactly what retiring a trading strategy should be governed by rather than by how the last fortnight felt.
For context on why the honest version of this matters, ESMA reported when it introduced its product intervention measures on 27 March 2018 that 74 to 89 percent of retail accounts typically lose money, with average losses per client running from 1,600 to 29,000 euros. A negative expectancy measured over a large sample is the arithmetic underneath that statistic. Most of the accounts inside it were not run by people who knew their own number.
Frequently Asked Questions
What is a good expectancy ratio in trading, in one line?
One that clears your monthly fixed costs per unit of risk turnover, with a sample behind it large enough that the confidence interval excludes zero. There is no universal figure, because the threshold depends on your costs and your trade frequency, not on the market.
Is 0.2R a good expectancy?
It is a common answer and it is unanswerable as asked. On the cost base in this article, 0.0333R is break even, so 0.2R clears it six times over and would be comfortable. On a desk with six times the costs and a fifth of the trades, the same 0.2R would not cover the bills. Compute your own threshold rather than adopting anyone else's.
How do I calculate expectancy?
Multiply your win rate by your average win in R, then subtract your loss rate multiplied by your average loss in R. If every loss is a full stop out, the second term is simply the loss rate. Use money at risk to define R, and use every closed trade rather than a selected period.
How many trades do I need before my expectancy means anything?
It depends on the size of the edge you are trying to detect. Assuming a 1.2R per trade standard deviation, roughly 62 trades for 0.30R, 139 for 0.20R, 246 for 0.15R and 554 for 0.10R. The smaller the edge, the longer the record needed, which is why modest edges are so easily mistaken for either genius or failure.
Can expectancy be positive while the account loses money?
Yes, and this is the trap the article is built around. Expectancy measured gross of costs can sit above zero while fixed monthly costs, commissions and financing take the desk below break even. It can also be positive on a sample too small to be trusted, in which case the positive sign is noise rather than evidence.
Where did the figures in this article come from?
Every expectancy, monthly figure, sample size and confidence interval is my own arithmetic on assumptions stated in the text: a 25,000 unit account, one percent risk, 250 units of monthly fixed cost, 30 trades a month, and a 1.2R per trade standard deviation with a two sided 95 percent interval. They are illustrations of a method, not measurements of any account or forecasts of any result. The retail loss range is quoted from ESMA's announcement of 27 March 2018, linked above.
Where REX Fits
REX Trading Signal is free to follow. Gold analysis and trade ideas posted with the reasoning attached, losing days included, plus an optional Kit for people who want the operating side written down. Nothing here promises a return, because a business that promises returns is not a business.
Knowing the number your desk has to clear is ordinary management accounting applied to a trading account. The one page trading business plan template is the pillar this sits under, and the break even expectancy belongs on it in writing. The key metrics every trading business should track puts expectancy alongside the other figures worth keeping, and the break even point of your trading business is the same calculation run on the whole operation instead of on a single trade.
About the author. Rex writes REX Trading Signal. He is interested in the unglamorous half of this business, the costs, the controls and the review dates, on the view that the interesting half takes care of itself once the dull half is written down.
Disclaimer: This article is general educational content about the arithmetic of expectancy and sample size. It is not financial advice, not accounting advice, not a recommendation to buy or sell any asset, and not a solicitation to trade. Every expectancy figure, monthly result, sample size and confidence interval is my own arithmetic on the assumptions stated in the text, chosen to illustrate a method. They are not forecasts, not measurements of any market, and not claims about anyone's results, mine included. The monthly figures are conditional statements about what the arithmetic yields if an expectancy holds, and no expectancy is guaranteed to hold. The 74 to 89 percent retail loss range and the 1,600 to 29,000 euro average loss range are quoted from the European Securities and Markets Authority announcement of 27 March 2018 and describe retail CFD accounts in EU jurisdictions during that period; rules and outcomes differ by jurisdiction and change over time. No gold price appears in this article. Trading gold, CFDs and leveraged products carries a high risk of losing money rapidly, and no entry, stop or target discussed should be treated as a signal. Readers should consider their own circumstances and speak to a licensed professional in their jurisdiction.