
Nobody ever asks how to calculate consistency in trading. They ask how to be consistent, which sounds like the same question and is not. One is a request for a measurement and the other is a request for a personality change, and only one of them can be delivered by Friday. Every other department of a real business has this settled. Nobody asks a bakery whether it feels consistent. They look at variance in output, they look at the worst week, and they decide from there.
So this article does the boring version. Three numbers you can calculate from a journal you already keep, and then, because a number is useless without a reference point, what those three numbers actually look like for a business that genuinely works. That second part surprised me, and it is the reason I wrote this.
Why Consistency Needs a Number Before It Needs an Opinion
Here is the problem with consistency as a feeling. It is assessed by memory, and memory samples badly. It over-weights the last two weeks, it over-weights losses, and it has no idea what the base rate is. So a trader with a perfectly sound operation concludes they are erratic, tightens the rules, tightens them again, and eventually abandons a method that was working, because it never felt like it was working.
The fix is not encouragement. It is a reference point. If you know that a business with a genuine edge typically has two or three losing months a year, then your two losing months stop being evidence of anything. If you know it typically contains a run of nine consecutive losing trades, then your run of seven stops being a crisis and becomes a Tuesday.
How to Calculate Consistency in Trading: Three Numbers
All three come out of a trade log with a date and a result. No software required.
1. The largest day share
Add up your profit for the period. Find your single best day. Divide one by the other. That percentage is how much of your result came from one session.
This is the measure the funded account industry adopted, usually as a rule that no single day may account for more than twenty or twenty five percent of total profit, and it is a good measure because it catches the specific failure it was designed to catch: a flat year rescued by one enormous outlier, which is not a business, it is a lottery ticket that happened to pay.
2. The coefficient of variation of monthly profit
Take your monthly results, calculate the standard deviation, divide by the average month. The result is the swing expressed as a multiple of the typical month. A value of 1.00 means your month to month variation is about as large as the month itself.
This one is the closest thing to what people actually mean by consistency, and it is the one nobody calculates, because it requires a formula rather than a glance.
3. The longest losing streak
Count the longest run of consecutive losing trades in the period. Not the largest loss, the longest run. This is the number that determines whether you will still be following the rules at the end of it, which makes it the most operationally important of the three, and the one traders most consistently underestimate.
What Normal Looks Like for a Business That Works
Now the reference point. I simulated 200,000 trading years for an operator with a genuine, positive edge, and asked what those three numbers came out as.
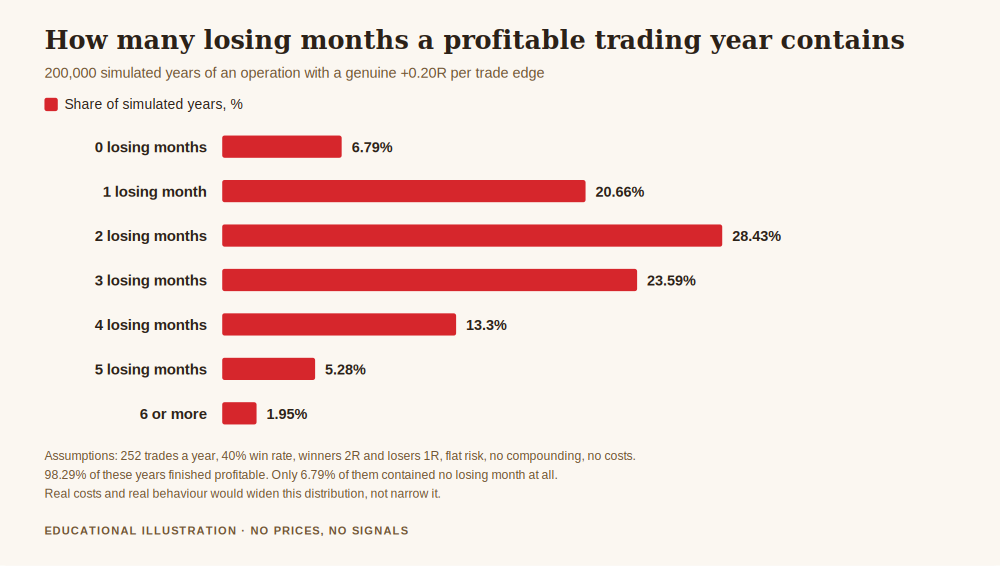
The assumptions are deliberately favourable and I want them stated plainly. Two hundred and fifty two trades a year, one per business day. Forty percent of trades win two units of risk, sixty percent lose one, which is an expectancy of positive 0.20R per trade and a theoretical year of positive 50R. Flat risk on every trade, no compounding, no costs, no mistakes, no revenge trades, no changing the plan. This is a better trader than either of us, running a perfect year.
Of those 200,000 years, 98.29% finished profitable. So the edge is real and it shows up almost every time. Now look at what the journey looked like.
Losing months. The median year contained two losing months out of twelve. The average was 2.40. Only 6.79% of years had no losing month at all, and 20.54% of years, more than one in five, contained four or more.
Longest losing streak. The median year contained a run of nine consecutive losing trades. Not nine losing trades in total, nine in a row. Eighty three percent of years contained a run of eight or more, and 45.24% contained a run of ten or more. At the ninety ninth percentile it reached seventeen.
Coefficient of variation of monthly profit. The median was 1.50. In other words, for a business with a real edge, the typical month to month swing was half again as large as the typical month. A quarter of years came in above 2.20, and the worst five percent above 5.41.
Largest day share. This one was the reassuring one. The median year had its best day accounting for 3.92% of annual profit, and only 2.59% of profitable years would have failed a rule capping any single day at twenty percent of the total. Concentration, it turns out, is the one thing a steady process genuinely does avoid.
What the Market Itself Says About Losing Months
Simulations are arguments, so here is a fact from outside the model.
Over the ten calendar years from 2016 to 2025 the published LBMA gold benchmark rose 303.6%. That is one of the better outcomes available to anyone in that decade, and it required no skill whatsoever, only the willingness to do nothing.
Across the 119 month on month comparisons in that period, 52 of them were down. That is 43.70% of months in the red, for the thing that tripled. The longest run of consecutive losing months was seven. In 2022 alone, eight of twelve months finished lower.
If the best performing asset in the room spent almost half its months losing and once had seven in a row, the question of whether your two losing months mean something has answered itself.
What To Do With Your Three Numbers
Calculate them for your own record, then use them the way a business owner uses any metric, which is to say for comparison against yourself over time rather than against anybody else.
The largest day share tells you whether your result is a process or an accident. If one day carries more than a fifth of the year, you do not have twelve months of evidence, you have one day of evidence and eleven months of noise, and you should be far less confident than your equity curve suggests.
The coefficient of variation is your planning number. If your monthly swing is 1.5 times your average month, then anything you intend to fund from trading income needs a buffer sized for that, which is the arithmetic behind building a cash reserve for your trading business. Planning to draw a steady salary from a series with that much variation is not a discipline problem, it is a cash flow error.
The longest losing streak is your rule design number. If the base rate says nine in a row will happen, then a rule that only survives six is not a rule, it is a countdown. Design for the streak you will actually meet, not the one you hope for.
What These Numbers Do Not Say
They do not say your losing streak was normal. They say a streak of that length is unremarkable for a process with a real edge, and whether yours has one is a separate question that these numbers cannot answer. A trader with no edge also has losing streaks, and their streaks look identical from inside. That distinction, and how many trades it takes to tell the two apart, is a different piece of arithmetic entirely.
They also do not transfer directly to your operation. My simulation assumed one trade per day, flat risk, fixed odds and zero costs. If you trade five times a day the monthly figures compress. If you size unevenly the largest day share climbs. Recalculate with your own trade count rather than borrowing mine.
And a consistent process is not automatically a profitable one. You can be reliably, measurably, admirably consistent at losing. Consistency is a description of variance, not a verdict on the edge, and treating a low variance record as proof of quality is its own error.
Get the free REX one page business plan, the sheet where your risk ceiling, your costs and the variance you plan around live together, so a bad month meets a number instead of a mood. One email, no spam, unsubscribe anytime.
Get the free business plan →Frequently Asked Questions
How do I calculate consistency in trading if I only have three months of data?
You can calculate all three numbers, but only the longest losing streak will mean much. Three monthly figures are not enough to produce a stable coefficient of variation, and a largest day share over a short window is dominated by whichever day happened to land in it. Calculate them anyway, write them down, and treat them as a starting entry in a series rather than a verdict.
How many losing months a year is normal?
In the simulation above, for an operator with a genuine positive edge, the median was two and the average 2.40, with more than one in five years containing four or more. Only 6.79% of years had none. For context from outside the model, the LBMA gold benchmark finished 43.70% of its months lower across a decade in which it rose 303.6%.
What is a good coefficient of variation for monthly results?
Lower is steadier, but there is no threshold that separates good from bad, because the figure depends heavily on how often you trade and how evenly you size. The median for the simulated business here was 1.50. The useful comparison is your own number this quarter against your own number last quarter, especially if your method has not changed and the figure has moved.
Is the twenty percent consistency rule from funded accounts a fair test?
On this evidence it is not a harsh one. Only 2.59% of profitable simulated years would have breached a twenty percent cap on any single day's share of profit, so a steady process passes it comfortably. It is designed to catch concentration rather than to catch variance, and it does that job well. It says almost nothing about whether the underlying method is any good.
Should I stop trading after a long losing streak?
That decision belongs to your written risk ceiling, set in advance, not to the streak itself. What the numbers here can tell you is that a run of nine appeared in the median year of a genuinely profitable operation, so streak length alone is weak evidence of a broken method. A rule that survives a normal streak, and a maximum drawdown that stops you before ruin, are the two things worth having in place before one arrives.
Where do these figures come from?
The distributions are from a Monte Carlo simulation I ran of 200,000 trading years under the assumptions stated in the article, all of which are listed so you can reproduce or challenge them. The monthly gold figures are computed from the published LBMA daily benchmark over 2016 to 2025 and the source is linked above. None of it comes from any account, mine included.
Where This Leaves You
Open your journal this weekend and produce three numbers: your largest day as a share of your profit, the standard deviation of your monthly results divided by the average, and the longest run of consecutive losses. It takes about twenty minutes with a spreadsheet and it converts the vaguest question in this business into three entries you can put in a file and compare against next quarter.
What you will probably find is that you are more consistent than you feel and less consistent than you would like, and that both of those were true of every working business in the simulation too. The point of measuring is not to feel better. It is to stop rebuilding a method every time it does something ordinary.
The framework this sits in is the one page trading business plan template. The wider reporting pack is in the key metrics every trading business should track, and the review rhythm that turns these numbers into decisions is in how to run a weekly review for your trading business.
About the author. Rex writes REX Trading Signal. He treats an account as a small business with costs, capacity and a set of books, on the view that most trading problems turn out to be operational once someone bothers to write the numbers down.
Disclaimer: This article is general educational content about measuring variance in trading results. It is not financial advice, not tax or legal advice, and not a recommendation of any instrument, broker, method, risk level or trading rule. Trading gold, CFDs and leveraged products carries a high risk of losing money rapidly. No entry, stop or target discussed should be treated as a signal. The distribution figures come from a Monte Carlo simulation of 200,000 trading years under stated assumptions, 252 trades a year, a 40% win rate, winners of two risk units, losers of one, flat risk, no compounding and no costs; those assumptions are simplifications chosen to be favourable, real costs and real behaviour would widen every distribution shown, and the simulation is not a claim that any such edge is achievable. The monthly and decade figures are computed from the published LBMA daily gold benchmark over 2016 to 2025, describe how a public benchmark behaved in the past and are not a forecast. The rules referred to in funded account programmes are described for context and vary between firms. No price levels are quoted anywhere in this article and no real trading results are represented. General educational material on trading risk is published by the US Commodity Futures Trading Commission.