
Open any signal channel and you will find entries written as a band rather than a price. Buy 4007 to 4010, that sort of thing. Nobody explains the convention because it looks self explanatory, so the question what is a buy zone in trading rarely gets asked out loud. A zone is simply a range of prices at which somebody considers the idea valid, instead of a single price. That part is genuinely harmless. The part that is not harmless is what a range does to the one number a trading business is supposed to hold fixed, which is the money at risk on any single position.
This is an accounting article, not a strategy article. There is no entry in it, no stop and no target. It is about what happens to your risk ceiling when the entry is a band, and about the one sizing rule that keeps the ceiling intact no matter where you fill.
Roughly 812 messages in my inbox mention lot size in some form. That is a keyword count rather than a survey, and it proves nothing by itself, but the shape of the questions is consistent. One reader asked: "How many layers and lot size do I have to open for a 500 account waiting to sell with you?" Another explained a bad day with "Not today as I said because I had a too high lot size, so I hope to recover soon." A third put it more bluntly: "I was cruising, I set a trade with high lot, market went against me." Everybody in that list is asking about size. Almost nobody is asking about the thing that decides size, which is the distance between where you actually filled and where you are wrong.
What is a buy zone in trading, stated plainly
A buy zone is a price range rather than a price. The person publishing it is saying that anywhere inside this band, the idea is still the idea. It exists because nobody can know in advance exactly where a market will turn, and because a single price will often be missed by a few cents while the band gets filled.
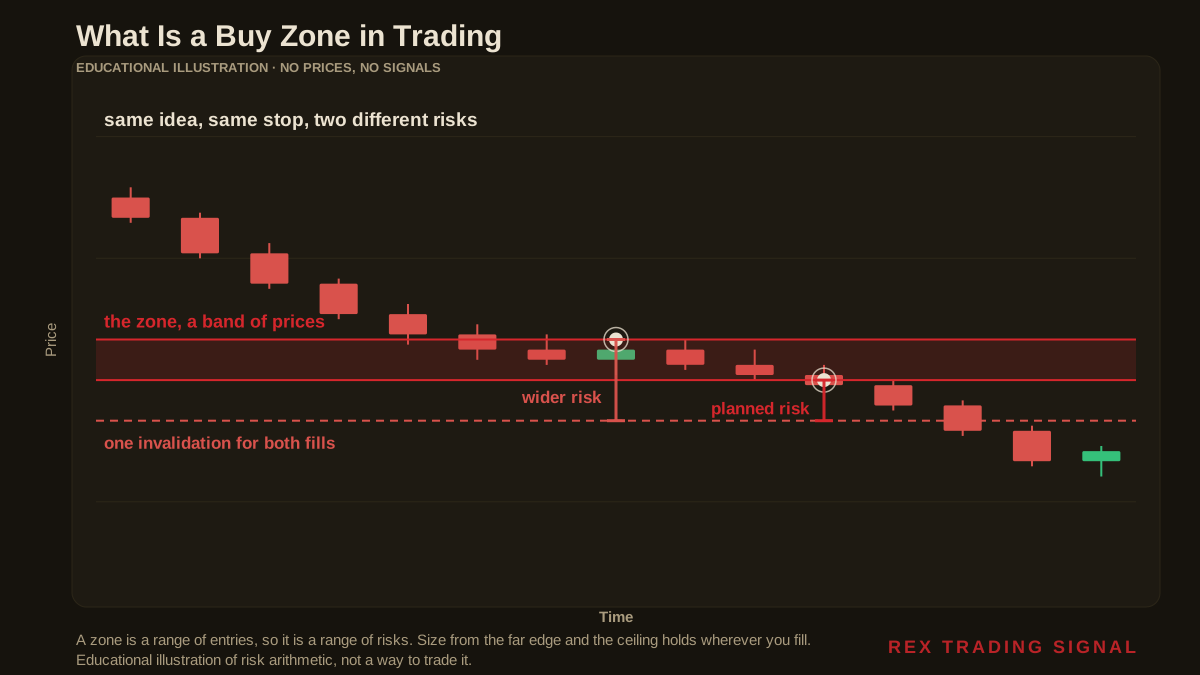
So far so reasonable. A zone is an honest admission that precision is not available. The trouble starts when the zone meets the other half of the arrangement, which is the invalidation level, and that one is published as a single price. One line. The same line for everybody.
Hold those two facts together and the problem states itself. The entry is a range. The exit on the wrong side is a point. Therefore the distance between them, which is the only thing that converts your position size into money, is also a range.
The arithmetic, with the assumptions written out
Take a business with a 10,000 unit account and a stated ceiling of 1 per cent per position. That is 100 units of currency at risk per trade, and the ceiling is the whole point of the document it is written in. Assume a zone three dollars wide per ounce, and an invalidation five dollars beyond the near edge of that zone. These are illustrative widths, not price levels, and nothing here suggests where either should go.
Fill at the near edge and the risk distance is five dollars. Fill at the far edge, three dollars higher, and the distance is eight dollars. That is a ratio of 1.60, and it is the entire article in one number.
Now size the position the way most people do, which is from the published entry, usually the near edge. One hundred units of risk divided by five dollars gives 20 ounces. Then the fill comes at the far edge instead, and those same 20 ounces are now exposed to an eight dollar move. The position risks 160 units, which is 1.60 per cent of the account, against a ceiling that says 1.00 per cent.
Nothing was broken. No rule was consciously ignored. The business simply recorded a 1 per cent risk and took a 1.6 per cent one.
If fills land evenly across the band over many trades, the average risk distance is 6.50 dollars, so the average position risks 130 units. That is 30 per cent more risk than the plan, on average, on every trade, quietly, for as long as the practice continues.
Why 30 per cent more risk is not 30 per cent more problem
Overshooting a risk ceiling does not hurt in proportion. It compounds, and losing streaks are where it shows up.
Eight consecutive losses at the planned 1 per cent takes the account down 7.73 per cent. Eight consecutive losses at the 1.60 per cent that a far edge fill produces takes it down 12.11 per cent. Ten in a row gives 9.56 per cent against 14.90 per cent. The gap widens the longer the streak runs, which is exactly the circumstance in which a business can least afford it.
That matters because the recovery arithmetic is unforgiving in the same direction, as I set out in the piece on risk of ruin. A deeper hole needs a disproportionately larger gain to climb out of, so the extra 30 per cent of risk you never agreed to take buys you a drawdown that costs considerably more than 30 per cent extra to repair.
And none of this appears in a review. The journal records a 1 per cent risk because that is what the plan said. The equity curve records something else. A business whose records and results disagree has no way to tell a bad method from a well executed one, which is the failure mode behind most of the metrics work in the metrics every trading business should track.
The rule that fixes it, and what it costs
The fix is one sentence. Size from the far edge of the zone, not the published entry.
Run the same numbers. Risk distance from the far edge is eight dollars, so 100 units divided by eight gives 12.5 ounces. Fill at the far edge and you risk exactly your ceiling. Fill at the near edge and you risk 62 units, which is 0.62 per cent, comfortably under it. The ceiling now holds wherever the fill lands, which is the only property a ceiling needs to have.
The cost is real and worth stating: the position is 37.5 per cent smaller than the one you would have taken sizing from the near edge. Winners are smaller by the same proportion.
That trade is worth making, for a reason that has nothing to do with being cautious. A risk ceiling you breach on roughly half your fills is not a ceiling, it is a hope, and a business cannot plan against a hope. The number you can rely on is worth more than the number you prefer, which is the same argument as the one in the 1 per cent rule.
What the zone is doing to your record keeping
There is a bookkeeping consequence as well, and it is the one that takes longest to notice.
If your results are measured in money or in pips, a zone quietly corrupts the series. Two trades on identical ideas with identical outcomes produce different numbers purely because of where inside the band each one filled. Over a hundred trades that noise is large enough to make a mediocre method look acceptable and a sound one look broken, which is why I keep arguing against counting results that way in measuring trading results in pips.
Measured in R, where one R is the money you decided to risk, the series stays clean, but only if R is fixed. Size from the far edge and it is fixed. Size from the published entry and your R silently changes trade by trade, so every statistic built on it is measuring your fills rather than your method.
Which brings this back to where a trading business should start. Write the rule down. The entry may be a range, the invalidation is a point, the size comes from the worst case distance between them. That belongs in the operating document, not in your memory, which is what the one page trading business plan is for.
What this article does not say
It does not say zones are wrong. A band is an honest way to express an idea whose precise turning point nobody knows, and converting it into a single price would be a false precision.
It does not tell you how wide a zone should be, where an invalidation belongs, or what ceiling to run. Three dollars, five dollars and 1 per cent are illustrative figures chosen to make the arithmetic legible. Your contract size, your account currency and your instrument will all change the units, though none of them change the ratio, which is the part that matters.
It also does not deal with partial fills across a band, or with filling in several pieces at different prices. That is a different structure with its own arithmetic, and I covered it separately in multiple entries on the same trade.
One more limit worth naming. Everything above assumes you actually fill inside the zone. If the market gaps or runs, a stop can fill beyond the level it was set at, and the eight dollar figure becomes optimistic rather than conservative. Contract conventions and the mechanics of how orders actually execute are set out by the CFTC's education centre, and the ounce the quote refers to is the troy ounce defined in the LBMA Good Delivery standard. Both are worth reading once, properly, before you assume any of this is automatic.
Get the free REX one page business plan, the document where rules like this one live so they survive a bad week. One email, no spam, unsubscribe anytime.
Get the free business plan →Putting it on the books
Three lines in the operating document, and the problem is closed.
First, record the zone width as a field on every trade, the same way you record the instrument. If you are not writing it down, you cannot audit whether your stated risk and your real risk ever agreed.
Second, size from the far edge, every time, with no discretion attached. Discretion here is just the breach arriving later.
Third, when you review the month, reconcile the risk you planned against the risk you actually carried. If those two columns differ, the difference is a process defect and not bad luck, and it is fixable in an afternoon, which is the kind of thing the weekly review exists to catch.
Frequently Asked Questions
What is a buy zone in trading, in one sentence?
It is a range of prices at which the person publishing it considers an idea valid, used instead of a single entry price because nobody knows precisely where a market will turn.
Is a buy zone worse than a single entry price?
Not in itself. It is more honest about the precision available. It becomes a problem only when the position is sized as though the entry were a single price while the invalidation genuinely is one.
Where should I size from inside the zone?
From the edge furthest from the invalidation, so the widest possible risk distance. That is the only choice that keeps your ceiling intact wherever the fill lands. The cost in the worked example is a position 37.5 per cent smaller.
How much extra risk does sizing from the near edge actually add?
In the example, a fill at the far edge carries 1.60 times the intended risk, so 1 per cent becomes 1.60 per cent. If fills land evenly across the band, the average is 1.30 per cent, meaning about 30 per cent more risk than planned on every trade.
Does this change my journal?
Yes. Record the zone width and the actual fill, not just the published entry. Without both, your R is not a constant, and every statistic computed from it is measuring your fills rather than your method.
Where did the numbers come from?
All of them are my own arithmetic on the stated assumptions: a 10,000 unit account, a 1 per cent ceiling, a zone three dollars wide and an invalidation five dollars beyond the near edge. The 1.60 ratio, the 1.30 per cent average, the 7.73 and 12.11 per cent drawdowns over eight losses, and the 37.5 per cent smaller position all follow from those figures and nothing else.
Where REX Trading Signal Fits
REX Trading Signal is free to follow. The daily record goes up on Telegram with the reasoning written before the trade rather than explained after it, losing days included. There is a free one page business plan, and an optional Kit for people who want the full operating system. Nothing here promises a profit, and nothing here is a signal service you should follow blindly.
About the author. Rex writes REX Trading Signal. He runs the account as a business, which mostly means that a rule which only holds on the good fills is not a rule yet. Nothing in this article is a recommendation to trade, and no entry, stop or target discussed should be treated as a signal.