
The kelly criterion for position sizing is the closest thing trading has to a mathematically correct bet size, and almost nobody who uses it well actually bets it. That sounds like a contradiction. It is not. It is the same reason a solvent business with a proven product still does not spend every available pound on inventory. The formula tells you the edge of the cliff. Knowing where the edge is, and standing well back from it, are two different decisions, and only the second one keeps the business open.
About 4 messages in my inbox ask this question in so many words, counted by keyword rather than by any survey, and roughly 812 touch lot sizing more broadly. They sound like this. "how much should i risk per trade?" "I have a $500 capital and I want to trade with 0.01 lot. Can you give me a simple plan?" "What do you recommend for safe lot size and risk per trade?" And the one that explains why the question matters: "Not today as I said because I had a too high lot size, so I hope to recover soon."
Every one of those is a sizing question, which means every one of them is a business question. So let me show you the formula, compute it honestly, and then show you the specific arithmetic that explains why operators run far below it.
What the kelly criterion for position sizing actually says
The criterion comes from a 1956 paper by J. L. Kelly Jr, "A New Interpretation of Information Rate", published in the Bell System Technical Journal, volume 35, pages 917 to 926. The DOI is 10.1002/j.1538-7305.1956.tb03809.x, and you can confirm that record through the Crossref metadata entry rather than taking my word for it. Kelly was not writing about trading. He was writing about information transmission over a noisy channel, and the betting interpretation came along for the ride.
For a simple two outcome bet, the fraction of capital to stake is:
f* = (p × b − q) ÷ b
where p is the probability of winning, q is one minus that, and b is the reward-to-risk ratio, meaning how many units you win per unit risked. What the formula maximises is the long run growth rate of capital, not the expected profit of any single bet. That distinction is the whole reason it is interesting, and the whole reason it is dangerous.
Running the numbers, with the assumptions on the table
Assume a reward-to-risk of 2 to 1, the same bet repeated, results independent of each other, and a win rate you know exactly. Hold on to that last assumption, because it is the one that fails in practice. On those assumptions:
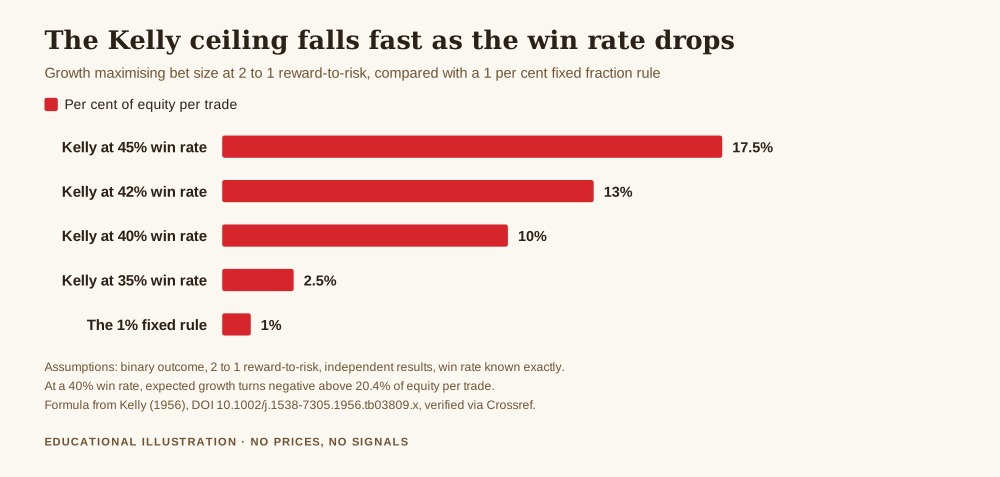
- At a 45 per cent win rate, the ceiling is 17.5 per cent of equity per trade.
- At 42 per cent, it is 13.0 per cent.
- At 40 per cent, it is 10.0 per cent.
- At 35 per cent, it is 2.5 per cent.
Look at the first number for a moment. Seventeen and a half per cent of the account on a single trade. Any experienced operator reading that will flinch, and they should, because an account doing that will see routine drawdowns that would end most people's willingness to continue. Yet on the stated assumptions, that is the growth maximising size. The formula is not wrong. The assumptions are what is doing the damage.
The fragility that makes the ceiling unusable as a target
Here is the number that should decide how you treat this formula. Move the win rate estimate from 45 per cent to 40 per cent, a five percentage point error, the kind of error any sample of a few hundred trades can easily produce. The ceiling falls from 17.5 per cent to 10.0 per cent, a 43 per cent cut in the correct bet size.
So a modest error in the input produces a very large error in the output. In engineering terms the function is badly conditioned near the values traders actually work with, and your win rate is never a known constant. It is an estimate from a limited sample, drawn from a market that changes underneath you.
Now the part I expected to go differently before I computed it. Suppose you size at the 45 per cent ceiling of 17.5 per cent, but your true win rate is only 40 per cent. The intuitive story is that you are now overbetting and the account bleeds. The arithmetic says otherwise: expected log growth per trade is still positive, about +0.0046. The account still grows, just more slowly and far more erratically than the operator believes.
The point where growth actually turns negative at a 40 per cent win rate is 20.4 per cent of equity per trade. That is the real cliff edge. And notice how close it sits to the 17.5 per cent you were told was optimal. The gap between the size you were aiming at and the size that quietly destroys capital is under three percentage points, and the only thing standing between them is the accuracy of a win rate you estimated from your own records.
That is the argument, and it is an arithmetic argument rather than a psychological one. The Kelly ceiling is not dangerous because traders are emotional. It is dangerous because it sits a very short distance from the point of ruin, and the input that determines the distance is the thing you know least precisely.
What a business does with a number like that
It uses it as a limit, not a plan. A haulage firm knows the maximum legal load for its vehicles. It does not load every lorry to that number every day, because the limit assumes dry roads, accurate weighing and a driver who is not tired. The margin between the legal maximum and the operating load is not timidity. It is the acknowledgement that the inputs are estimates.
Run the same comparison on the sizing rule most operators actually use. A 1 per cent fixed fraction rule is 18 times below the 17.5 per cent ceiling computed above. That is not a small safety margin, it is an enormous one, and it is deliberate. It buys three things worth more than the theoretical growth rate you gave up:
Survivable drawdowns. At 1 per cent per trade, a run of ten consecutive losses costs under 10 per cent of the account. At 17.5 per cent, the same run is close to terminal. The business has to still exist on the other side of a bad month, and a sizing rule that only works when the sample behaves is not a rule.
Tolerance for a wrong estimate. If your true win rate is five points worse than you think, a 1 per cent rule barely notices. The Kelly ceiling nearly halves. Any limit that depends on an input being correct is a limit that will fail on the day the input is wrong, which is precisely the day you need it.
A number you can actually follow. This is the operational point and it gets dismissed too easily. A rule you abandon under pressure is worth nothing, however correct it was on paper. The messages at the top of this article are not from people who miscalculated a formula. They are from people who took a size they could not hold.
Half Kelly, and what it is really doing
The common compromise is to bet a fraction of the ceiling, usually a half. On the numbers above, half of the 45 per cent ceiling is 8.75 per cent per trade. That is still roughly nine times a 1 per cent rule, and still far more variance than most accounts are built to absorb.
Fractional Kelly is best understood not as timidity but as a correction for the confidence you do not have. If your win rate estimate carries meaningful uncertainty, the right response is to bet as though the worse end of your estimate were true. Half Kelly is a rough proxy for that. Working from the pessimistic end of your own numbers directly is a better one, and it is the version a business would recognise, because it is what every sensible forecast does with an uncertain input.
The hurdle the whole exercise has to clear
One more number, because it keeps the discussion honest. From the Federal Reserve's H.15 Selected Interest Rates release dated 2 November 2026, the 1 year Treasury bill yielded 4.17 per cent on 30 October 2026.
That is the return available for taking no market risk at all. Any sizing policy, Kelly derived or otherwise, is being run in order to beat it by enough to justify the drawdowns, the screen time and the cost base. An operator who takes significant risk for a year and lands near that figure has, in business terms, worked for nothing. Putting that number at the top of the annual review changes how the sizing question gets asked, and it is a more useful anchor than any formula on this page.
Get the free REX one page trading business plan, with the risk limit, the review cadence and the cost lines on a single sheet, so the sizing decision on this page is made once rather than every morning. One email, no spam, unsubscribe anytime.
Get the free business plan →Frequently asked questions
Should I use the kelly criterion for position sizing in forex?
As a ceiling to stay well below, it is genuinely useful. As a target size, the arithmetic above argues against it: the growth maximising size at a 45 per cent win rate and 2 to 1 reward-to-risk is 17.5 per cent of equity, and the point where growth turns negative at a 40 per cent win rate is 20.4 per cent. Those two numbers are under three percentage points apart, and the gap between them is set by an input you can only estimate.
How do I calculate my win rate for the formula?
From your own closed trades, over a sample large enough to mean something, and with the understanding that it is an estimate rather than a constant. Then use the pessimistic end of that estimate in the formula. If a hundred trades gave you 45 per cent, the honest input is a range, not the midpoint, and sizing off the midpoint is the error the whole article is about.
What is half Kelly?
Betting half the computed ceiling, which on the numbers above is 8.75 per cent of equity per trade rather than 17.5 per cent. It is a rough correction for uncertainty in your win rate estimate. It is still roughly nine times a 1 per cent fixed fraction rule, so it is a reduction in aggression rather than a conservative policy.
Why do most professionals risk around 1 per cent?
Because it is 18 times below the ceiling computed here, which means it keeps working when the win rate estimate turns out to be wrong, when trades are correlated rather than independent, and when the market stops resembling the sample the estimate came from. It trades theoretical growth for the ability to still be operating next year.
Does Kelly assume my trades are independent?
Yes, and that assumption is often false in practice. Taking three correlated gold positions at 1 per cent each is closer to a single 3 per cent position than to three separate bets. Any sizing formula applied per trade, Kelly included, understates the real exposure when positions move together, which is another reason the computed ceiling overstates the size a real book can carry.
Where REX Trading Signal fits
REX Trading Signal is free to follow. The daily record on Telegram includes losing days, because a record that only shows winners is not a record. There is a free one page trading business plan for anyone who wants the limits and the review cadence in one place, and an optional Kit for people who want the full operating method. Nothing here promises a profit and nothing here is a signal service. The foundation this article sits on is the one page trading business plan template, the practical version of the sizing decision is in position sizing for gold trading, the rule this article keeps comparing against is in the trading 1 per cent rule, the failure mode it protects against is in risk of ruin in trading, and the input the formula depends on is covered in what a good expectancy ratio is.
About the author. Rex writes REX Trading Signal and treats an account the way an operator treats a business, with limits set before the week starts and a review that happens whether the month was good or bad. He is less interested in what a trader thinks will happen next than in what the records say already happened. The figures here are computed from the stated assumptions so you can repeat them with your own numbers, the sources are linked and were checked before publication, nothing here is investment advice, and no entry, stop or target discussed should be treated as a signal.