
Somebody asked me last month whether they should take a prop firm deal or keep grinding their own small balance, and the way they put it stuck with me. One reader wrote: "Should I get a prop firm to solve the equity problem or trade minimally with the small capital I have". That is not a strategy question. That is a capital question, and it is the one retail trading almost never teaches you to ask. So this piece is about what is risk adjusted return on capital, a measure banks use to answer exactly that, and what happens when you point it at a one person desk.
Fair warning about what follows. Every number below is my own simulation, written out with its assumptions so you can disagree with the inputs. There is no claim here about what any system earns, and the most useful result in the piece is the one where the answer comes out negative.
What is risk adjusted return on capital, in one line
Risk adjusted return on capital, usually shortened to RAROC, is the return a business makes divided by the capital that business has to keep tied up to make it. That is the whole idea. The return goes on top, the capital at risk goes underneath, and you get a percentage you can compare against doing nothing.
Most trading talk never gets past the top line. Profit factor, win rate, total pips, the number in the corner of the statement. All of those describe the numerator. RAROC is the question banks got forced into decades ago, which is: fine, but how much money did we have to lock up and not use for anything else in order to produce that?
The denominator is where the idea actually lives
The capital underneath the line has a name in banking. It is economic capital, and the Basel Committee's paper Range of practices and issues in economic capital frameworks defines it as "the methods or practices that allow banks to consistently assess risk and attribute capital to cover the economic effects of risk-taking activities".
Read that again with your own account in mind. Attribute capital to cover the economic effects of risk taking. Not the margin your broker asks for. Not the money in the account today. The amount that has to be available so that the bad run, when it arrives, does not end the business.
The Federal Reserve's Trading and Capital-Markets Activities Manual treats this as a core function rather than an optional refinement. It lists "delineating capital allocation and portfolio management" among the things a risk management mandate must cover, and it is explicit that this sits separate from the people running day to day positions. A real desk does not let the trader decide how much capital stands behind the trader.
For a one person business there is no committee, so you have to do both jobs and keep them honest. The practical definition I use is this: economic capital is the drawdown you would have to be able to absorb before you would be forced to stop. Then you have to pick a confidence level, because there is no drawdown you absolutely cannot exceed. I use the 99th percentile, which means I size for the worst year in a hundred and accept that the hundredth one beats me.
Three systems, one expectancy, three different businesses
Here is where it stops being abstract. I built three systems with deliberately identical expectancy, +0.05 R per trade, where R is whatever you risk on one trade. Over 250 trades a year each one expects +12.50 R. They differ only in shape. System A wins 70 per cent of the time at 0.5 to 1. System B wins 45 per cent at 1.33 to 1. System C wins 25 per cent at 3.2 to 1.
On every retail scorecard these are the same system. I simulated 50,000 years of each and measured the worst peak to trough drawdown, then took the 99th percentile as the economic capital.
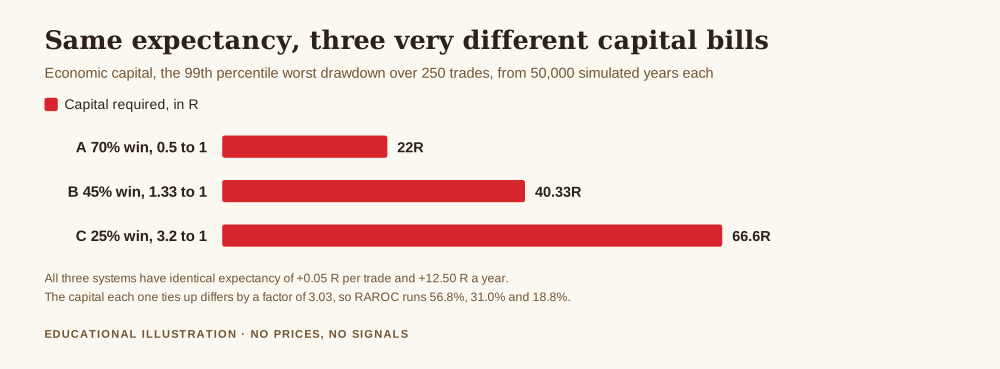
System A needs 22.00 R of capital behind it. System B needs 40.33 R. System C needs 66.60 R. Same expected return, and a capital bill that differs by a factor of 3.03.
Divide the return by the capital and you get the RAROC: 56.8 per cent for A, 31.0 per cent for B, 18.8 per cent for C. As businesses these are not remotely comparable, and nothing on a conventional performance report would have told you. This is the same reasoning as judging a good risk adjusted return, except the denominator is cash you must hold rather than volatility you must endure, which is the version a business owner can actually act on.
The honest caveat is that this depends on how you define economic capital, and a different confidence level moves all three numbers. What it does not move is the ordering, or the fact that the spread is large.
Trading more does not get you more, it costs you more
Now hold the annual edge constant at 12.5 R and change only how many trades you spread it over. The per trade edge shrinks as the count rises, which is realistic, because nobody finds a thousand opportunities a year as good as their best fifty.
At 50 trades a year the economic capital is 16.44 R. At 250 it is 40.33 R. At 1,000 it is 87.75 R. The same annual result, and more than five times the capital tied up to produce it. RAROC falls from 76.0 per cent to 31.0 per cent to 14.2 per cent.
That is worth sitting with, because the instinct when results are thin is almost always to trade more. In capital terms, trading more is a decision to run a larger and less efficient business for the same output. I wrote about the behavioural side of this in how to not over trade, but the capital arithmetic makes the case without any reference to discipline at all.
The hurdle, and the question it forces you to answer
A RAROC number means nothing on its own. It needs something to clear. The Federal Reserve manual puts the general principle plainly in its discussion of investment appraisal: "When IRR is greater than the required return, or the 'hurdle rate,' the investment is considered acceptable."
For a trading business the floor is what the money earns doing nothing. The Federal Reserve H.15 release for 13 October 2026 puts the one year Treasury constant maturity at 4.48 per cent. That is the honest hurdle, and it is not a high bar.
Take system B. On an assumption I will state openly, that 1R is 1 per cent of a 10,000 unit account so 1R is 100 units, system B ties up 4,033 units to produce an expected 1,250 units. Carrying that capital at 4.48 per cent costs 181 units a year, which is 14.5 per cent of the expected result. For system C the carry is 298 units, or 23.9 per cent. Nearly a quarter of the output of system C is consumed by the cost of the capital standing behind it, before a single trading cost appears.
Then you put the costs in, and the picture changes
Everything above ignored spread and commission. Adding a flat 0.02 R per trade, which is modest rather than pessimistic, does this.
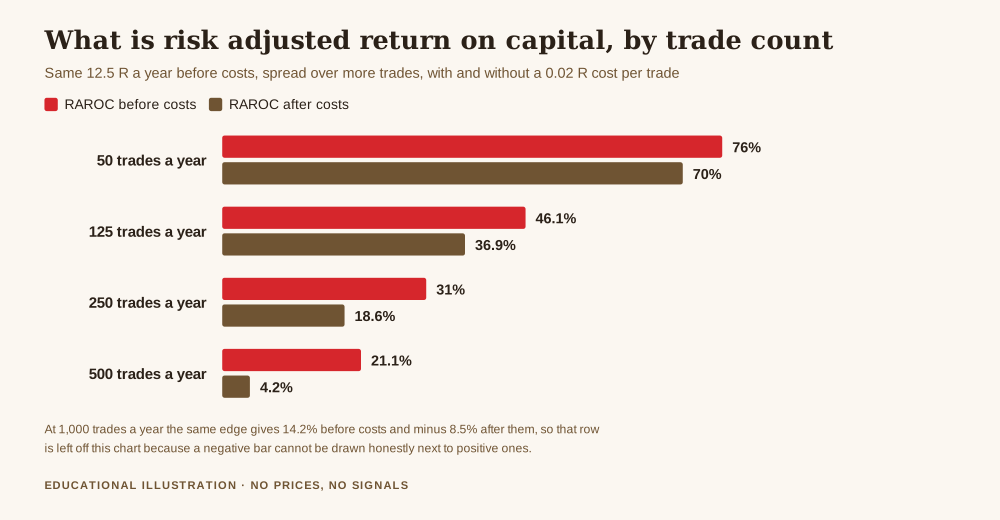
At 50 trades a year the cost takes RAROC from 76.0 to 70.0 per cent, barely a scratch. At 500 trades it takes 21.1 per cent down to 4.2 per cent, which no longer clears the 4.48 per cent hurdle. At 1,000 trades the same annual edge turns into minus 8.5 per cent. The costs have eaten 7.5 R of a 12.5 R edge and you are running a large capital base to lose money slowly.
You can read the breaking point directly. At 250 trades a year the business stops clearing the hurdle once costs reach 0.0428 R per trade, and reaches zero at 0.0500 R. At 1,000 trades those thresholds are 0.0086 R and 0.0125 R. The faster you trade, the narrower the band of costs you can survive, and it narrows fast. That is the same bill I counted in fixed and variable costs of a trading business, now expressed as the thing it actually destroys.
What I do with this
I do not compute a 50,000 path simulation before every trade, and nobody should. What I take from the method is three habits.
Write the capital number down before the strategy goes live. Decide what drawdown would force you to stop, and treat that as the capital the strategy consumes. Another reader put the constraint in exactly the right language: "With a capital less than 500 can't afford more than 200 points I think." That is RAROC thinking without the acronym, and it is the correct instinct.
Compare strategies by what they tie up, not by what they return. If two approaches produce similar results and one needs half the capital behind it, the choice has been made for you, and it is not the one with the better looking equity curve.
Treat the hurdle as real. The money sitting as your buffer has an alternative use with a published rate. A business that returns less than its own capital's opportunity cost is a hobby with extra steps, and I would rather know that early. Roughly 151 messages in my inbox mention trading a small account, and that is a keyword count rather than a survey, but the thread running through them is the same: people trying to force a result out of a capital base that cannot support it. One of them wrote: "I've been reading for six months. I have a small $100 capital, I'm not yet profitable." The answer there is not a better entry. It is that the business is undercapitalised for the risk it is being asked to carry, and no strategy fixes that.
The number I would want you to leave with is not 56.8 per cent or 18.8 per cent. It is 3.03, the factor by which the capital requirement differed between systems that looked identical on every scorecard retail trading hands you. The denominator was doing all the work, and nobody was looking at it.
Get the free REX business plan template, one page covering your risk ceiling, your costs and the review schedule that keeps a record honest. One email, no spam, unsubscribe anytime.
Get the free business plan →Frequently asked questions
What is risk adjusted return on capital in simple terms?
It is the return of a business divided by the capital that has to stay available to absorb its bad runs. For a trading account, that denominator is the drawdown you must be able to survive, not the margin your broker requires.
Is RAROC the same as the Sharpe ratio?
No. Both adjust a result for risk, but Sharpe divides by volatility while RAROC divides by capital held. Sharpe tells you how bumpy the ride was. RAROC tells you how much money was locked up to buy the ticket, which is the question a business owner has to answer.
How do I work out my own economic capital?
Pick the drawdown level that would force you to stop, in R or in account percentage, and set your confidence level deliberately. I used the 99th percentile worst drawdown from simulation. A simpler version is your own worst historical drawdown with a margin on top, as long as you remember your history is a small sample.
What hurdle rate should a retail trader use?
At minimum what the capital earns risk free, which was 4.48 per cent for the one year Treasury on 13 October 2026 per the Federal Reserve. Whether you add a premium on top for the work and the risk is your call, and the honest version of that call is a higher bar rather than a lower one.
Does a prop firm account solve the capital problem?
It changes whose capital is at risk, which is a real difference, but it does not remove the denominator. The evaluation fee, the drawdown rules and the share you give up all reappear in the arithmetic. The capital question is still there, in a different place.
Why does trading more reduce RAROC in your numbers?
Because I held the annual edge fixed while raising the trade count, so each trade carries less edge while the number of chances to draw down rises. The deepest expected drawdown grows with the number of trades, so the capital requirement grows while the return does not.
Where REX fits
Where REX fits
REX Trading Signal is a free channel about running a trading account the way you would run a small business, with a risk ceiling, a cost line and a review you actually do. There is nothing sold on a promise of returns here. The free business plan template is one page, and its job is to make you write down the limits before the market asks you about them. The piece everything else hangs off is the one page trading business plan template.
About the author. Rex writes REX Trading Signal. He ran two strategies side by side for a year, called the one with the bigger total the winner, and only worked out afterwards that it had needed three times the cash sitting idle behind it. He has written the capital number down first ever since.
Sources and method. The definition of economic capital is quoted from the Basel Committee's Range of practices and issues in economic capital frameworks, March 2009. The hurdle rate principle and the capital allocation mandate are quoted from the Federal Reserve's Trading and Capital-Markets Activities Manual. The 4.48 per cent hurdle is the one year Treasury constant maturity from Federal Reserve release H.15 for 13 October 2026. All three sources are linked above. Every other figure on this page is my own Monte Carlo simulation, seed 20261015, 50,000 paths for the three system comparison and 20,000 for the trade count table, with expectancy, win rate, payoff, trade count, confidence level and cost per trade all stated in the text so the work can be repeated or disputed.
This article is educational and is not financial advice. Trading gold and other leveraged products carries a high risk of losing money rapidly, and no entry, stop or target discussed should be treated as a signal. The systems described are constructed examples with assumed inputs, not records of any real account, and nothing here claims or implies that any strategy produces a positive return. The conversion of R into account units rests on the single assumption stated in the text. Reader quotations are real messages, anonymised and lightly edited, and the inbox count is a keyword count rather than a survey. Decide your own risk, and never trade money you cannot afford to lose.