
Every business that has ever existed has a capacity limit. A kitchen can plate so many covers an hour. A workshop can turn out so many units a week. Push past the limit and the output does not scale with the effort, it degrades, because the constraint was never the number of hours available. Learning how to not over trade is the same problem wearing different clothes, and it is an operations problem long before it is a psychology one.
I want to keep this away from willpower entirely. The usual advice, be more disciplined, take fewer trades, is true and useless, in the way that telling a restaurant to plate fewer bad dishes is true and useless. What a business does instead is find the constraint, price it, and set a ceiling that respects it. That is a thing you can actually do on a Sunday afternoon.
Find the Line That Scales With Volume
Run your account as a set of books for a moment. Every trade you take generates one item of revenue, uncertain, and one item of cost, near certain. The uncertain item is your edge. The certain item is friction, which is spread plus commission plus slippage on the round turn.
Here is the whole argument in one sentence. Friction scales exactly with the number of trades. Edge does not.
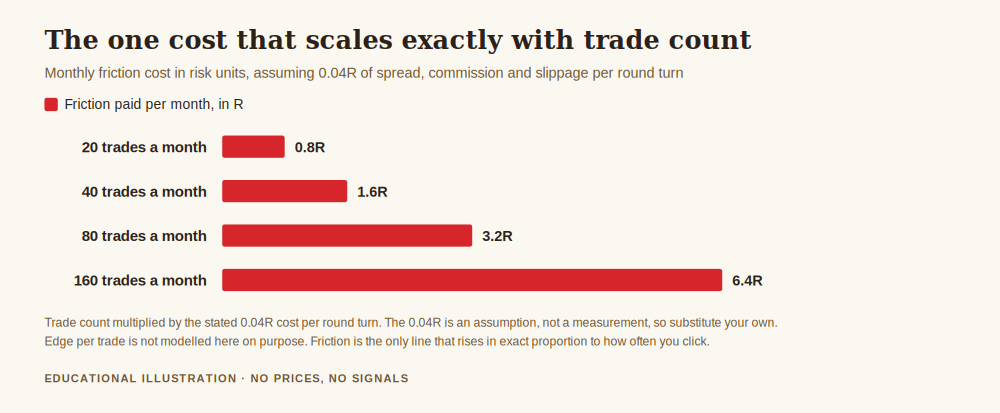
Suppose friction costs you four hundredths of a risk unit on each round turn. That is an assumption, not a measurement, and you should substitute your own once you have checked your statements. At twenty trades a month that is 0.8R of friction. At forty trades, 1.6R. At eighty, 3.2R. At a hundred and sixty, 6.4R. Straight multiplication, no forecast involved.
Now put edge next to it. Say your best work, the trades you would take if you were only allowed twenty a month, carries a gross expectancy of 0.12R. Subtract the 0.04R of friction and you net 0.08R per trade, 1.60R for the month. Fine.
The trap is assuming that eighty trades gets you four times that. It does not, because the extra sixty trades are not copies of the first twenty. They are the ones you passed over for a reason. If quality falls as volume rises, and it does, the arithmetic turns over quickly:
- Twenty trades at 0.12R gross, 0.08R net, plus 1.60R for the month.
- Forty trades at 0.07R gross, 0.03R net, plus 1.20R for the month.
- Eighty trades at 0.03R gross, minus 0.01R net, minus 0.80R for the month.
- A hundred and sixty trades at 0.01R gross, minus 0.03R net, minus 4.80R for the month.
Four times the work, four times the screen time, four times the stress, and a worse month than if you had gone fishing after trade twenty. The gross edge figures there are illustrative, chosen to show the shape. The friction figure is the one that matters, because it is the only column that behaves predictably.
The Break-Even Nobody Calculates
There is a single number that decides whether any given trade belongs in the business, and it is easier to compute than most traders expect. Your gross expectancy on a trade has to exceed your friction on that trade. At 0.04R of friction, a trade with a gross expectancy of 0.04R is worth exactly nothing, and a trade below it destroys value no matter how it feels while it is open.
Put differently, if your gross edge on a good trade is 0.10R, friction is already eating forty per cent of it. Anything you take that is meaningfully worse than your good trades is not marginal profit. It is a cost centre you opened voluntarily.
This is why I find "just take fewer trades" unhelpful as advice and useful as an output. The number of trades is not the thing to control. The threshold is. Control the threshold and the count falls out of it.
How to Not Over Trade When the Screen Is Open All Day
The practical measures are the ones a business would recognise, and none of them require you to feel calm.
Set a production ceiling in advance. A weekly maximum number of trades, written down on Sunday, treated the way a workshop treats its scheduled output. Not a target. A ceiling. When it is reached, the shop is closed regardless of what the chart is doing. If the ceiling is regularly binding, that is data about your threshold, not permission to raise it.
Price the shelf space. Every open position occupies attention, margin and risk budget. We looked at the carry side of that in how long can a trade stay open, and the same logic applies to the queue of trades you are considering. If a new idea is worse than something you already hold, the business decision is to keep holding, not to add.
Separate scanning from executing. Most overtrading happens because the person who finds ideas and the person who approves them are the same person at the same moment. A business splits those roles. You can split them in time instead: find ideas in one session, approve them in another, and never approve one in the minute you found it.
Log the trades you did not take. This sounds like busywork and it is the single most useful habit I know for this problem. A month of declined trades tells you whether your threshold is too high, too low, or about right, which is the one question the account statement cannot answer. If you do not have a record structure yet, how to keep a trading journal like a professional covers the format.
Treat a losing run as a capacity signal, not a recovery opportunity. The instinct after a bad week is to increase throughput. Every operations manual on earth says the opposite: when quality falls, slow the line and find the cause.
The Evidence That This Is Not Just My Opinion
The relationship between trading frequency and results has been measured carefully, on a large sample, by people with no product to sell.
Brad Barber and Terrance Odean published Trading Is Hazardous to Your Wealth: The Common Stock Investment Performance of Individual Investors in The Journal of Finance in 2000, volume 55, pages 773 to 806, DOI 10.1111/0022-1082.00226. They studied 66,465 households with accounts at a large discount broker between 1991 and 1996. Their finding, stated in the paper's own abstract: those that trade most earn an annual return of 11.4 per cent, while the market returns 17.9 per cent. The average household earns 16.4 per cent and turns over 75 per cent of its portfolio annually. The full paper is available from the authors.
That is a gap of 6.5 percentage points a year between the most active traders and the market they were trading in. Not between good traders and bad ones. Between the busy and the index.
Two honest caveats, because this is a study of US equities in the nineties and we trade gold today. It does not transfer as a number, and nobody should quote 11.4 per cent as though it predicts anything about a gold account. What transfers is the direction and the mechanism: higher turnover, higher costs, worse net results, on a sample large enough that luck cannot explain it. The authors attribute the high trading levels to overconfidence, which is to say the operators believed their capacity was larger than it was.
What This Does Not Say
It does not say that fewer trades is automatically better. A business that produces nothing has cut its costs to zero and also its revenue. There is a genuine failure mode on the other side, the trader so afraid of overtrading that they never take the trades their own method identifies, and that person is not running a conservative business, they are running no business.
It does not say that your friction is 0.04R. Go and find out. It is on your statements and it is probably not the number you assume.
It does not say that a high trade count is always overtrading. A scalper with genuinely low costs and a genuine short horizon edge is running a different factory with a different constraint. The test is not the count. The test is whether gross expectancy per trade still clears friction at the volume you are running.
Where REX Fits
REX is free to follow. The daily record goes out with the reasoning stated before the outcome is known, losing days included, because a business plan that only shows the good weeks is marketing. There is a free one page business plan template for anyone who wants to write their ceiling and their threshold down in one place, and an optional Kit for people who want the full operating system. Nothing here promises a profit and nothing here is a signal service. If you want the foundation, start with the one page trading business plan template.
Get the free REX one page business plan, including the weekly production ceiling and the threshold worksheet described in this article. One email, no spam, unsubscribe anytime.
Get the free business plan →Frequently Asked Questions
How many trades a week is overtrading?
There is no universal number, and anyone who gives you one is guessing. The test is whether your gross expectancy per trade still exceeds your friction per trade at the volume you are running. For one operator that breaks at eight trades a week, for another at eighty. Measure your own friction first, because that half of the comparison is knowable.
What exactly counts as friction?
Spread paid on entry and exit, commission both ways, any swap or financing if the position is held overnight, and slippage against your intended price. Express it as a fraction of the amount you risk on a trade so it is directly comparable with your edge. If you risk one unit and friction costs four hundredths of that unit, friction is 0.04R.
I only overtrade after a loss. Is that different?
The cause is different, the cost is identical. The ceiling handles both, which is the advantage of a ceiling over a resolution. A rule that closes the shop at a fixed number of trades does not need to know why you wanted the extra ones.
Does a smaller position size fix overtrading?
Only partly. Halving your size halves the risk per trade and halves the friction per trade in absolute terms, but the ratio of friction to edge is unchanged, so a trade that was value destroying before is still value destroying. It buys you survival time, not profitability.
Where did the numbers in this article come from?
The friction table is the stated 0.04R cost multiplied by the trade count, nothing more. The monthly net figures multiply a stated gross expectancy by a stated trade count and subtract that friction, and the gross figures are illustrative and labelled as such. The Barber and Odean figures are quoted from the paper's own abstract and the paper is linked above, with its DOI verified through Crossref.
Set the ceiling before the week starts, price your friction from the statement rather than from memory, and let the trade count be the output of your threshold instead of the input to your hopes.
About the author. Rex writes REX Trading. He came to this from running an actual business with actual inventory, which is why he finds capacity planning a more interesting subject than entries and keeps saying so to people who would rather talk about setups. Nothing in this article is a recommendation to trade, and no entry, stop or target discussed should be treated as a signal.