
What does profit factor mean in trading? Gross profit divided by gross loss. Add up every winning trade, add up every losing trade, divide the first by the second. A profit factor of 1.50 means the system took one and a half units out for every unit it put at risk and lost. That is the whole definition, and it takes ten seconds to calculate from any statement.
It is also the single most over trusted number on a results page, and I say that as someone who used to lead with it. A business owner looking at a profit factor is looking at something close to a gross margin, which is useful, but no one runs a company on gross margin alone. You want to know how bad the cash position got on the way, whether one customer carried the year, and whether the figure is measured over enough months to mean anything. Profit factor answers none of those, and this article is about what it leaves out.
Everything below is simulated with a fixed seed and stated assumptions, so you can reproduce it. No figure here comes from my own account or anybody else's.
What does profit factor mean in trading, in precise terms
Take the formula apart. If your win rate is w and your average winner is R times your average loser, then gross profit is w times R and gross loss is one minus w, so the profit factor is wR divided by (1 minus w). That is worth writing down because it tells you immediately that profit factor is not an independent fact about a system. It is a single number compressed out of two.
Run a few combinations and you see how loose that compression is. A 60 per cent win rate at 1 to 1 gives 1.500. A 30 per cent win rate at 3 to 1 gives 1.286. A 70 per cent win rate at 0.5 to 1 gives 1.167. A 50 per cent win rate at 1 to 1 gives exactly 1.000, which is the breakeven line before a single cost is deducted.
That breakeven line is the first genuinely useful thing the number gives you. A profit factor of 1.0 means gross profit equals gross loss, so the system is a machine for converting time into nothing. Anything below 1.0 is a machine for converting capital into somebody else's revenue. There is no interpretation, no market regime and no run of bad luck that changes what a sub 1.0 figure means over a long enough record.
What the number hides: the path
Here is the problem. Profit factor has no memory of order. It adds up all the wins and all the losses as if they arrived in a pile rather than a sequence, and a business is run in sequence. You pay rent monthly, not on average.
To show what that costs, I built three systems with an identical profit factor of 1.50. A 60 per cent win rate at 1 to 1. A 30 per cent win rate at 3.5 to 1. A 20 per cent win rate at 6 to 1. Check them against the formula and all three come out at exactly 1.500. On a results page, they are the same system.
Then I simulated 200 trades for each, 20,000 times over, with a fixed seed, treating trades as independent and risking one R per trade. The measured outcome is not remotely the same.
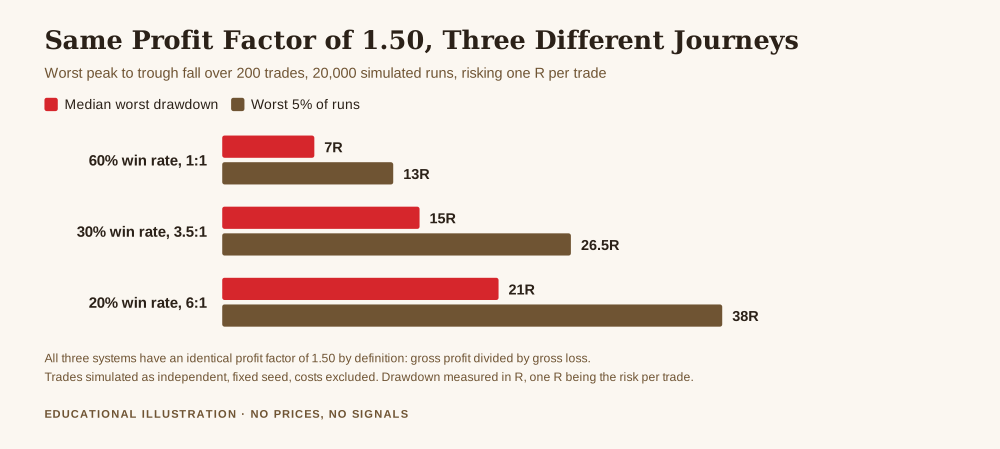
The median worst drawdown goes from 7R to 15R to 21R as the win rate falls, and in the worst 5 per cent of runs it goes from 13R to 38R. The median longest losing streak goes from 5 trades to 12 to 18. Same profit factor. Nearly three times the hole to climb out of, and a losing run more than three times as long to sit through without touching anything.
If you size positions off a drawdown assumption, which any business with a risk ceiling does, then picking a system on profit factor alone can quietly load you with three times the drawdown you planned for. The number did not lie to you. It just never answered the question you needed answered, which is the same reason a single headline figure never settles anything in the set of metrics a trading business actually tracks.
What the number hides: concentration
The second omission is customer concentration, to keep the business analogy running. If one client is 40 per cent of your revenue, your margin looks fine right up to the morning they leave.
Take 50 trades of that 20 per cent win rate system. Gross profit 60R, gross loss 40R, profit factor 1.50. Now delete the single best trade, as though you had been away that afternoon, or the order had been rejected, or you had taken it a day early. The profit factor falls to 1.35, a drop of 10 per cent of the figure from removing 2 per cent of the trades.
On a system that takes rare large winners, the profit factor is substantially the property of a handful of trades. That is not a flaw in the system, it is what that design is. But it does mean the number is fragile in a specific way worth knowing, and it is why the question "how many trades produced most of this?" belongs next to it on the sheet.
What the number hides: how little it knows
The third omission is the one that costs people the most money, because it feels like the opposite of a problem. A high profit factor on a short record is not good news. It is mostly noise, and I can put a figure on how much.
I took a system whose true profit factor is 1.50 by construction, the 60 per cent win rate at 1 to 1, and measured what a sample of its trades reports. Across 20,000 samples:
- After 20 trades, 90 per cent of samples report a profit factor somewhere between 0.67 and 4.00.
- After 50 trades, between 0.92 and 2.57.
- After 100 trades, between 1.08 and 2.12.
- After 500 trades, between 1.29 and 1.75.
Read the first line again. A genuinely profitable system, measured over 20 trades, will report a losing profit factor often enough that you should expect it, and will report a spectacular 4.00 about as often. Both are the same system. Neither number is a fact about the strategy, they are facts about the sample size.
This is the mechanism behind a good deal of what gets sold online. Any system, run over enough short windows, produces windows that look superb, and those are the ones that end up in the advertisement. It is also why a strategy you abandoned after fifteen bad trades may have been fine, and why one you are confident in after twenty good ones has told you almost nothing yet. The honest threshold is in the hundreds, which is a slow answer nobody wants, and the reason retiring a strategy should be a decision with a number attached rather than a feeling.
Costs come off the top, and they come off fast
One more piece of arithmetic, because this is where a business plan gets decided. Costs do not reduce your profit factor gently, they attack both halves of the fraction at once: every winner is smaller and every loser is bigger.
Take the 60 per cent at 1 to 1 system and charge a cost per trade as a fraction of the risk, covering spread, commission and slippage together. At zero cost, the profit factor is 1.500. At a cost of 5 per cent of risk per trade, it falls to 1.357. At 10 per cent, to 1.227. At 20 per cent of risk per trade, it is exactly 1.000, and the edge is gone entirely.
Nothing about the strategy changed in that paragraph. The entries, the exits and the win rate are all identical. The whole edge was consumed by execution costs that a backtest typically understates. If you trade a system with a small edge at high frequency, the cost line is not a detail of the business, it is the business, which is the same conclusion the fixed and variable costs of a trading business arrive at from the other direction.
Losing runs are a cost of operating, not a malfunction
One reason people abandon a working system is that they have no prior expectation for how bad a normal stretch looks. So, simulated on the same assumptions, for that 60 per cent win rate system: across 200 trades, the chance of hitting a losing run of 4 or more is 96.0 per cent. Of 5 or more, 71.2 per cent. Of 6 or more, 38.4 per cent. Of 8 or more, 7.5 per cent.
A five trade losing streak is not a signal. At that win rate it is the single most likely thing to happen to you across a year of trading, and the business decision is to have the capital and the written rules to sit through it, not to react to it. The number worth knowing in advance is what a normal bad stretch costs you, which belongs in the plan rather than in a message to yourself at 11pm.
How to actually use it
None of this makes profit factor a bad metric. It makes it one line of a report rather than the report. Read it as a gross margin: it tells you whether the thing earns more than it costs, and nothing about liquidity, concentration or timing.
Put next to it the three things it cannot say. The worst drawdown, which tells you whether you could have survived the path. The number of trades, which tells you whether the figure means anything yet. And the contribution of your largest few winners, which tells you how much of the result is resting on exceptions. Four numbers together describe a business. One of them on its own describes a hope. The sheet I use to keep all of this on one page is the one page trading business plan, and the companion measure worth learning next is expectancy, which answers what an average trade is worth rather than what the pile is worth.
The wider context is worth holding on to as well. The European Securities and Markets Authority, setting out its 2018 product intervention measures, reported that national regulators found "74-89% of retail accounts typically lose money on their investments, with average losses per client ranging from €1,600 to €29,000". And the most cited study of individual investors, Barber and Odean's work in The Journal of Finance, found that the most active traders underperformed the market substantially after costs. Measuring honestly is not pessimism. It is the only thing that separates a business from an expensive hobby.
Get the free REX one page business plan, the sheet that keeps profit factor next to drawdown, sample size and concentration instead of on its own. One email, no spam, unsubscribe anytime.
Get the free business plan →Frequently asked questions
What is a good profit factor in trading?
The honest answer is that the question is missing a second half: good over how many trades, and with what drawdown. Anything at or below 1.0 is not viable, because gross losses match or exceed gross profits before costs. Above that, a figure of 1.50 measured over 500 trades tells you far more than a 3.00 measured over 25, since on my simulation a true 1.50 system reports anywhere from 0.67 to 4.00 across 20 trade samples. Judge the sample before you judge the number.
Is profit factor the same as expectancy?
No, and they answer different questions. Profit factor is a ratio of totals, so it tells you how much the pile of wins exceeds the pile of losses. Expectancy is a per trade average, so it tells you what one more trade is worth on average. A system can have an attractive profit factor and an expectancy too small to cover costs once you account for how rarely it trades.
Why does my profit factor fall when I add commission?
Because costs hit both halves of the fraction at once. Every winner comes in smaller and every loser goes out larger, so the numerator falls while the denominator rises. On a 60 per cent win rate system at 1 to 1, a cost of 10 per cent of the risk per trade takes the profit factor from 1.500 to 1.227, and 20 per cent takes it to exactly 1.000. The entries never changed.
Can a system with a low win rate have a high profit factor?
Yes, and that is the normal shape of a trend following business. A 20 per cent win rate at 6 to 1 produces a profit factor of 1.50, identical to a 60 per cent win rate at 1 to 1. What differs is the path: in my simulation the low win rate version carried a median worst drawdown of 21R against 7R, and a median longest losing streak of 18 trades against 5.
How many trades before I can trust the figure?
More than most people want to hear. On the simulation above, the 90 per cent range only narrows to roughly 1.29 to 1.75 around a true value of 1.50 after 500 trades. At 100 trades it is still 1.08 to 2.12. That does not mean you learn nothing before then, it means you should hold the number loosely and avoid making irreversible decisions, like sizing up, on a short record.
Where REX Trading Signal fits
REX Trading Signal is a free journal about running a trading account like a business, which mostly means writing the decision down before taking it instead of justifying it afterwards. Nothing here is sold on a promise of returns, and there is no signal service to subscribe to. The free one page business plan is the sheet that keeps a metric like this one next to the three figures that give it meaning. The piece underneath all of it is the one page trading business plan.
About the author. Rex spent a year quoting a profit factor from a 30 trade sample before working out what a 30 trade sample can actually support, which was close to nothing. He runs the account like a business because the alternative was running it like a hobby that happened to involve money.
Risk disclosure. This article is educational and is not financial advice. Trading gold and other leveraged products carries a high risk of losing money rapidly, and no entry, stop or target discussed should be treated as a signal. Every profit factor, drawdown, streak probability and sample range above is computed by simulation from the stated assumptions, with a fixed seed, treating trades as independent and excluding fees unless stated, and is an illustration of arithmetic rather than a forecast or any account's measured results. The retail loss statistics are the European Securities and Markets Authority's own, and the individual investor study is Barber and Odean, The Journal of Finance, 2000, DOI 10.1111/0022-1082.00226, verified through Crossref. Decide your own risk, and never trade money you cannot afford to lose.