
Two words get used interchangeably in trading conversations, and they do not mean the same thing. Somebody says they are weighing up the trade off, somebody else says the opportunity cost of sitting out is too high, and both of them are usually doing the arithmetic wrong. Opportunity cost vs trade off is not a semantic quibble for economics students. In a trading business it is the difference between a decision you can price and a decision you are guessing at, and the gap between the two is where money quietly leaves the account.
So this is an operations article, not a philosophy one. Definitions first, then four numbers you can compute for your own account this afternoon.
Opportunity Cost vs Trade Off, Defined Properly
A trade off is the set of alternatives you give up when you choose. If three positions are available and you can hold one, the trade off is that choosing one means declining the other two. That is the shape of the decision.
Opportunity cost is narrower and it is a value, not a list. The Federal Reserve Bank of St. Louis puts it precisely in its economics teaching material: economists define an opportunity cost as the most highly valued opportunity given up when you make a choice. The most highly valued one. Singular.
Here is why that matters at the desk. Suppose you can take position A, position B, or hold cash, and your own estimates of value are, in R multiples, plus 0.20 for A, plus 0.35 for B, and plus 0.05 for holding. If you take A, the trade off is that you gave up both B and cash. The opportunity cost is B alone, at plus 0.35, because that is the best thing you sacrificed. The net value of your decision is 0.20 minus 0.35, which is minus 0.15R.
The common mistake is to add up everything forgone, which double counts, since you could only have had one of them anyway. The other mistake, more common and more expensive, is to leave cash out of the comparison entirely, as though the option of doing nothing has no value. It has a value, and later in this article that value has a published number attached to it.
Your Risk Budget Is a Fixed Number of Slots
The reason a trading business faces opportunity cost at all is that its capacity is finite, and the binding constraint is not usually money. It is the total risk you allow to be open at once.
Set a ceiling on simultaneous open risk, divide by the risk you take per position, and you get the number of slots your business runs:
| Open risk ceiling | At 0.5% per trade | At 1% per trade | At 2% per trade |
|---|---|---|---|
| 4% | 8 slots | 4 slots | 2 slots |
| 6% | 12 slots | 6 slots | 3 slots |
| 10% | 20 slots | 10 slots | 5 slots |
That is a division, not an opinion. Slots are the infrastructure of the business, in exactly the way that seats are the infrastructure of a restaurant, and once you see them that way the next question follows immediately. What happens when a customer arrives and every seat is taken?
The Number Almost Nobody Computes
Telephone networks solved this problem a century ago, and the arithmetic transfers cleanly. If opportunities arrive at random, each occupies a slot for some average duration, and an opportunity that finds every slot busy is simply lost rather than queued, then the share you lose is given by the Erlang B formula. That last condition is what makes it fit trading so well. A setup you cannot take does not wait politely for capacity, it is gone.
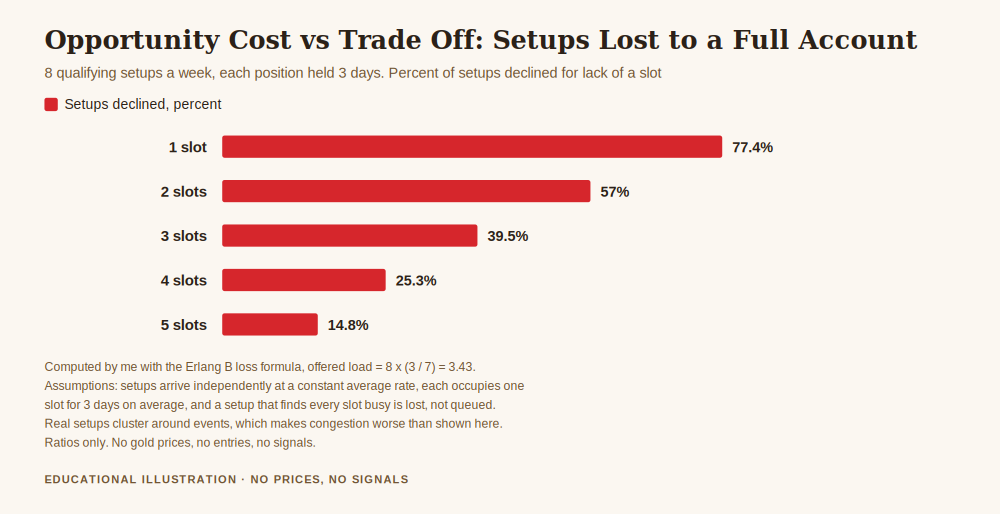
Assume opportunities arrive independently at a steady average rate, and that each position is held for a given number of days. The offered load is the arrival rate multiplied by the holding time. Here is the share of opportunities declined purely because the account was full:
| Setups per week | Held for | 2 slots | 3 slots | 4 slots | 5 slots |
|---|---|---|---|---|---|
| 3 | 2 days | 16.5% | 4.5% | 1.0% | 0.2% |
| 5 | 3 days | 42.2% | 23.2% | 11.0% | 4.5% |
| 8 | 3 days | 57.0% | 39.5% | 25.3% | 14.8% |
| 10 | 3 days | 63.5% | 47.6% | 33.8% | 22.4% |
Take the third row. Eight setups a week, each held three days, three slots open: 39.5 percent of your own qualifying opportunities never get taken. Not because you judged them badly, not because you lacked discipline, but because the shelf was full when they arrived.
Widening to four slots drops that to 25.3 percent, a gain of 14.2 percentage points, bought by accepting more simultaneous risk. Now you have a genuine trade off, with both sides denominated: more opportunities captured against a larger worst case if everything moves against you at once. That is a business decision. Without the table it is a feeling.
What Holding On Longer Actually Costs
The same model prices something traders almost never price: duration. Hold eight setups a week through three slots and vary only the holding period.
- Held 1 day: 8.2 percent of opportunities declined for lack of space
- Held 2 days: 25.2 percent
- Held 3 days: 39.5 percent
- Held 5 days: 57.4 percent
- Held 10 days: 76.2 percent
Staying in a position is not free just because it is not costing you anything visible. It occupies capacity, and the capacity has a queue behind it. A position left open for a week and a half is charging you three quarters of your own opportunity flow for the privilege.
This is not an argument for cutting winners early, which is a separate and expensive error we covered in how to take profit like a business. It is an argument for knowing the rent, and for noticing that the rent is highest exactly when opportunities are plentiful. The same held position costs almost nothing in a quiet fortnight.
The Price of Idle Cash Is Published Daily
Now the piece that turns opportunity cost from a metaphor into a line item. Money sitting in a trading account usually earns nothing. Money has a market price, and it is published every day.
From the Federal Reserve's H.15 selected interest rates release, for 21 August 2026, the 3 month Treasury bill in the secondary market was at 3.72 percent, and the effective federal funds rate was 3.63 percent. Assume your broker pays nothing on the balance, ignore compounding, and the annual cost of capital sitting there is simply the balance multiplied by 3.72 percent:
- 5,000 dollars idle for a year: 186 dollars given up
- 10,000 dollars: 372 dollars
- 25,000 dollars: 930 dollars
- 50,000 dollars: 1,860 dollars
Here is the part I find genuinely useful. Convert that into the currency your business already thinks in. If you risk 1 percent per position and your average trade is worth 0.2R, purely as an illustrative assumption rather than a claim about anyone's results, then one average trade is worth 0.002 of your equity, and the forgone interest equals 18.6 average trades per year. That figure is the same at every account size, because both sides scale with equity. Capital sitting still costs you roughly nineteen average trades a year, whether you are running five thousand dollars or five hundred thousand.
Which cuts both ways, and I want to be careful here. It is not an argument for trading more. It is an argument for putting the true number on doing nothing, so that the comparison is honest. If your realistic edge is thin, 18.6 average trades a year is a small price for staying out of a market you do not understand yet. If your process is sound and you are sitting out through indecision, it is a real and recurring cost that no one is invoicing you for.
Writing It Into the Operating Plan
Four things follow, and all of them belong on paper rather than in your head.
First, know your slot count. Ceiling divided by per trade risk. Every trading business has this number whether or not the owner has ever calculated it.
Second, measure your actual opportunity flow for a month. Count qualifying setups, whether or not you took them. You cannot price capacity without knowing demand, and almost nobody records the setups they had to decline.
Third, record the ones you turned down and why. The reason matters enormously. Declined because the account was full is a capacity problem with a costed solution. Declined because you hesitated is a different problem entirely, and it belongs in the review discussed in the weekly review.
Fourth, when you compare two courses of action, name the single best alternative and value it. Not all of them, and never zero of them. That is the whole discipline of opportunity cost vs trade off, and it is one line of arithmetic.
One caution before you take these tables too literally. The queueing model assumes opportunities arrive independently at a constant average rate, and they do not. Gold setups cluster around scheduled events and volatility regimes, and clustering makes congestion worse than the formula suggests, not better. Treat the percentages as the optimistic case.
Get the free REX one page business plan, the sheet where your open risk ceiling, your slot count and your stopping rule live in one place instead of in your memory. One email, no spam, unsubscribe anytime.
Get the free business plan →Frequently Asked Questions
Opportunity cost vs trade off, what is the difference in one sentence?
A trade off is everything you give up by choosing, and opportunity cost is the value of the single best thing among them. The St. Louis Fed's teaching material states it as the most highly valued opportunity given up when you make a choice.
Is holding cash an opportunity cost or a trade off?
Both, depending on which side you look from. Holding cash is one alternative in the trade off, and if it is the best thing you gave up then its value is the opportunity cost. Its value is not zero: at the 3 month Treasury bill rate of 3.72 percent reported on 21 August 2026, a 10,000 dollar balance earning nothing forgoes 372 dollars a year.
Does this mean I should open more positions?
No, and I would resist that reading. It means the cost of not opening them is now a number rather than a feeling, so the comparison against a larger worst case can be made honestly. More slots means more simultaneous risk, and that is exactly the trade off the arithmetic is there to expose.
Where does the queueing formula come from?
It is Erlang B, developed for telephone exchanges, which prices the share of arrivals lost when every server is busy and nothing waits in a queue. It fits trading because a setup you cannot take does not queue, it disappears. The assumptions are stated above, and real setups cluster rather than arriving independently.
How do I measure my own opportunity flow?
Log every setup that met your criteria for a month, including the ones you did not take, with the reason. Most journals only record executed trades, which makes the declined ones invisible and their cost unmeasurable. The trading journal template has a column for it.
Where REX Fits
REX Trading Signal is free to follow, with daily XAUUSD analysis and the reasoning stated before the trade, and an optional Kit for people who want the operating side written down properly. Nothing here promises a profit and nothing here ever will.
The operating side is the whole point. The one page trading business plan template is the pillar this sits under, because a capacity limit only works if it exists on paper before the fifth setup of the week arrives. Managing multiple trading accounts deals with what happens when you try to buy capacity by adding accounts, what a good risk adjusted return is covers the other side of the same ratio, and the metrics every trading business should track is where the declined setup count belongs.
About the author. Rex writes REX Trading Signal. He is interested in the unglamorous half of this business, the costs, the controls and the review dates, on the view that an account survives on its operating discipline long before it succeeds on its ideas.
Disclaimer: This article is general educational content about decision costs in a trading business. It is not financial advice, not investment advice, and not a recommendation to open, hold or decline any position. The definition of opportunity cost is quoted from the Federal Reserve Bank of St. Louis economics education material. The 3.72 percent 3 month Treasury bill rate and the 3.63 percent effective federal funds rate are for 21 August 2026 from the Federal Reserve H.15 release, are historical figures rather than a forecast, and are not an offer of any rate to you. The slot counts, the blocking percentages, the holding period figures, the forgone interest amounts and the figure of 18.6 average trades were all computed by me on assumptions stated in the text: a fixed open risk ceiling, independent arrivals at a constant average rate, a constant average holding period, a broker paying no interest on balances, no compounding, and an illustrative average trade worth 0.2R. The 0.2R figure is an assumption chosen to make the arithmetic concrete, not a claim about the results of this channel or of any reader, and no trading results are represented anywhere in this article. Real opportunities cluster rather than arriving independently, so the blocking figures are optimistic. Trading gold, CFDs and leveraged products carries a high risk of losing money rapidly, and no entry, stop or target discussed should be treated as a signal. No gold price level is quoted anywhere in this article.