
A reader wrote to me in September with a short message. Down 22 per cent, he said, and he wanted to know how long it would take to get back. Not what strategy to use, not whether to change markets. Just how long. It is the best question anyone has asked me all year, because it is the only one with an answer, and almost nobody asks it. Most of what gets written about how to recover from a trading loss is about feelings. This article is about the schedule.
A business that loses a quarter of its working capital does not ask itself whether it believes in the business. It opens the accounts, works out what the hole costs to fill at the current rate of earning, and decides whether it can fund the gap for that long. That calculation is unpleasant and it is short. Here it is.
Everything numerical below is either quoted from the European regulator I link, or my own calculation from assumptions I state as I go. Nothing here is a forecast of what your account will do, and every rate I use is a fixed illustration chosen to expose the arithmetic.
First, the size of the hole, which is the easy part
You already half know this. A drawdown of 20 per cent needs a 25 per cent gain on what is left to return to the starting line, because the gain is calculated on the smaller base. The formula is the drawdown divided by one minus the drawdown. That is the part every article covers, and it is also the part that is least useful, because a percentage is not a plan. A plan has a date on it.
So convert the percentage into the only unit a trading business actually spends: trades, and the weeks they take.
How to recover from a trading loss, measured in trades rather than feelings
To put a date on it you need two numbers you should already be tracking, and if you are not, that is the real finding of this exercise. I set out the full list in the metrics every trading business should track.
The first is your risk per trade as a fraction of current equity. The second is your expectancy, the average result of a trade measured in R, where one R is the amount you risk. Multiply them and you get the expected growth of your equity per trade. At 1 per cent risk and an expectancy of 0.08R, that is 0.08 per cent of equity per trade. Small. It is supposed to be small.
Now compound it. The number of trades to climb out of a drawdown is the logarithm of one over one minus the drawdown, divided by the logarithm of one plus that per trade growth. I have used 0.08R as the expectancy throughout, which is a figure I picked to make the mechanism visible, not an estimate of yours.
At 1 per cent risk, recovering a 10 per cent drawdown takes about 132 trades. A 20 per cent drawdown takes about 279. A 30 per cent drawdown takes about 446.
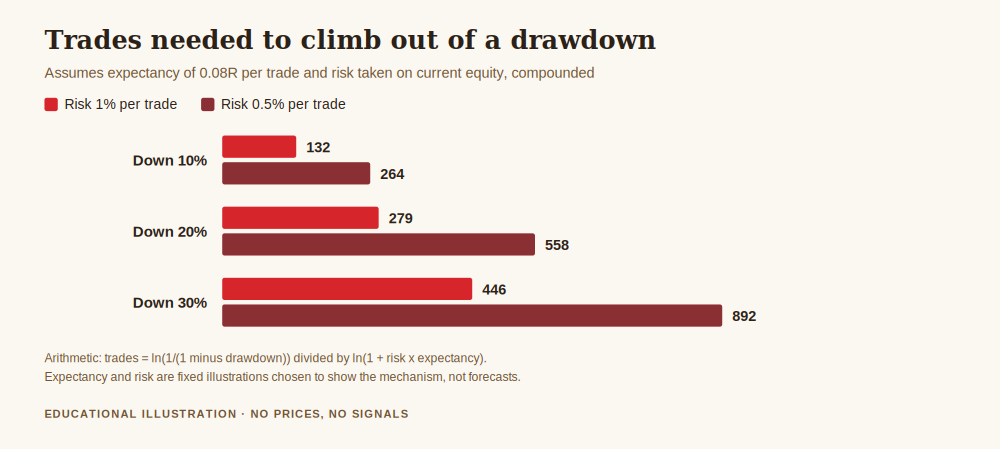
Put a calendar against those. At five trades a week, 279 trades is about 56 weeks, which is just under 13 months. That is the real answer to the reader's question, and it is the number nobody wants, because it is not a bad quarter, it is more than a year of the business doing nothing except returning to where it already was.
The decision that doubles the schedule
Here is the part that is genuinely counterintuitive, and it is where most recovery plans quietly go wrong.
The sensible instinct after a drawdown is to cut size. It is the right instinct. But look at what it does to the timetable. Halve the risk from 1 per cent to 0.5 per cent and the per trade growth halves too, from 0.08 per cent to 0.04 per cent. The 20 per cent recovery goes from 279 trades to 558. At the same five trades a week, just under 13 months becomes just under 26 months.
The doubling is exact, and it is not a reason to avoid cutting size. It is the price of the insurance, and the point of writing it down is that a business that buys insurance knows what the premium is. Most traders cut size as a reflex, feel responsible for having done it, and never notice they have signed up for a two year project instead of a one year one.
Both of those are defensible decisions. Only one of them is a decision, as opposed to a mood.
The number the regulator publishes, and what it does to the plan
There is one more input, and it is the one people leave out because it is uncomfortable. The expectancy above is assumed to be positive. For most retail accounts it is not.
When the European Securities and Markets Authority set out its product intervention measures on contracts for difference, it published what the national regulators had found: 74 to 89 per cent of retail accounts typically lose money, with average losses per client ranging from 1,600 to 29,000 euros.
Read that against the arithmetic above and the conclusion is uncomfortable but clean. A recovery schedule built on a positive expectancy is only valid if you have measured a positive expectancy. If you have not, the model does not say you recover slowly. It says you do not recover at all, and every additional trade makes the hole deeper on the same compounding that was supposed to fill it.
So the schedule has a precondition. Before you plan a recovery, you have to establish that the thing you are scaling back up is worth scaling. That is a measurement, not a belief, and it needs a sample, which is the whole argument for the records I keep banging on about.
The recovery budget, written as a business document
This is how I would actually write it down, as four lines in the operating manual rather than a resolution.
Line one, the measurement. What is my expectancy over my last hundred trades, and is it positive? If I cannot answer from records, the recovery starts with the records, not with a trade.
Line two, the size. What risk per trade am I funding this with, and what does that choice do to the schedule? Write both numbers down. Half size doubles the timetable, and that is acceptable if it is chosen rather than drifted into.
Line three, the date. Trades required divided by my realistic trade rate, converted to weeks and then to months. Put the actual month in the document. A recovery plan without a date is a wish, and a 13 month date tends to change how people feel about taking a marginal setup on a Tuesday.
Line four, the stop. What further loss ends this plan rather than extending it? A business sets a figure below which it stops funding a line, and it sets it in advance, because the moment you need it is the moment you are least able to decide. I wrote about where that line sits in how to know when to stop trading.
What a business does not do while it is down
Three behaviours, all of which look like recovery and are not.
It does not raise prices to fill a hole faster. Increasing risk per trade shortens the schedule on paper and widens the distribution enormously. Doubling risk halves the expected trade count and also makes a second drawdown of the same depth roughly twice as damaging. You are not accelerating the plan, you are swapping it for a different plan with a fatter left tail.
It does not change the product mid recovery. A new market or a new method resets your sample to zero at the exact moment your sample is the only asset you have. Whatever expectancy you measured no longer applies, and you have no basis for any schedule at all.
It does not treat the loss as unpaid. The money is gone. It is a cost that has already been incurred, and I argued the accounting of that in is a losing trade a business expense. Nothing you do next recovers that specific money. You are not winning it back, you are earning new money on a smaller base, and those are different activities that feel identical from the inside.
What the arithmetic cannot tell you
Limits, plainly. Every figure above follows from an assumed expectancy of 0.08R, an assumed risk per trade, and an assumed five trades a week. All three are illustrations I fixed in advance. None is a forecast, a target, or a claim about what is achievable.
The model also assumes trades are independent and that your expectancy is stable, and neither holds in practice. Losses cluster, and conditions change, which means the real distribution of recovery times is wider than a single number suggests and the long tail is longer than the model says.
And the biggest limit of all: arithmetic cannot tell you whether to keep funding the business. A 26 month recovery is survivable for one person and ruinous for another, and the difference is not in the spreadsheet, it is in the rest of your life. That part is yours.
Get the free REX one page business plan, the sheet I use to run an account like a business, including the drawdown line that says when a recovery plan stops and gets reviewed instead. One email, no spam, unsubscribe anytime.
Get the free business plan →Frequently asked questions
How to recover from a trading loss without taking bigger risks?
By accepting a longer schedule and writing the date down. At 1 per cent risk and an expectancy of 0.08R, a 20 per cent drawdown takes about 279 trades, which is roughly 13 months at five trades a week. Raising risk shortens that on paper and widens the distribution of outcomes at the same time.
How long does it take to recover a 20 per cent drawdown?
On the illustrative figures used here, about 279 trades at 1 per cent risk, or about 558 at half a per cent. Converted at five trades a week that is roughly 13 months and roughly 26 months respectively. Your own numbers will differ, and the method matters more than mine.
Should I reduce my position size after a loss?
That is your call and this is not advice. What the arithmetic says is that halving risk exactly doubles the number of trades required, so the choice is between a wider tail and a longer timetable. Make it deliberately and record which one you chose.
Is a losing streak proof my system is broken?
Not on its own, and not without a sample. The question is whether your measured expectancy over a meaningful number of trades is positive. That is a records question, and if the records do not exist, neither does the answer.
Why does the gain needed exceed the loss taken?
Because the gain is earned on the smaller balance left after the loss. Down 20 per cent needs 25 per cent back, calculated as the drawdown divided by one minus the drawdown.
What proportion of retail accounts actually lose money?
According to the analyses ESMA cited from national regulators when it introduced its CFD measures, 74 to 89 per cent of retail accounts typically lose money, with average losses between 1,600 and 29,000 euros. That is the base rate any recovery plan is written against.
Where REX fits
REX Trading Signal is a free journal about running a trading account the way you would run a business, with books, costs, policies and an operating manual. Everything here is free to read. The one optional piece is the one page business plan above. I do not promise profits, I do not sell a method, and I do not think anyone can tell you what your account will do. The piece this one hangs off is the one page trading business plan, and the sizing side continues in the one per cent rule.
About the author. Rex runs his account from a written operating manual, and once spent fourteen months filling a hole he had not bothered to put a date on, which is the only reason this article has one. He would rather show you the arithmetic than the equity curve. Nothing in this article is financial advice, and no entry, stop or target discussed should be treated as a signal.