
A trading business decides it wants some gold exposure without running a leveraged position, opens a fund on the platform, and looks at the chart. The line goes up and to the right, the volume bars look healthy, and the decision feels made. But working out how to read etf chart data properly means knowing that the line you are looking at is not the fund. It is what the last buyer agreed to pay for a piece of the fund, which is a different number, and the gap between the two is money that leaves your business without ever appearing as a cost.
This is a due diligence article, not a strategy article. There is no entry here, no stop and no target. It is about reading an instrument's price display the way you would read a supplier's invoice, which is to say sceptically, and with the question of what you are actually being charged kept in front of you.
The instinct behind this article usually shows up attached to a different instrument. Roughly 44 messages in my inbox mention slippage or the spread, which is a keyword count rather than a survey, but the worry in them is the right one. One reader asked: "Why is my spread so wide? Is it because I am using a standard account?" Another mentioned, almost in passing, that "I have always traded on zero spread acc." Both are circling the same question a fund buyer ought to ask before committing capital: what am I being charged that nobody is showing me?
How to read ETF chart prices, and the two numbers underneath
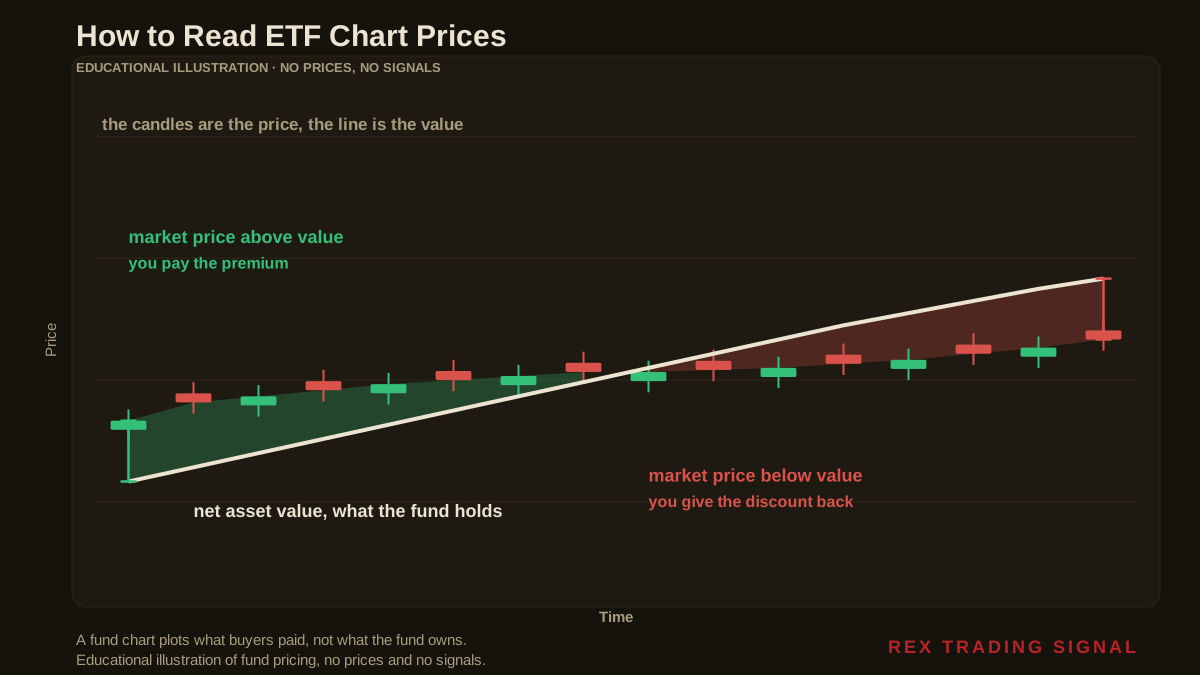
Every exchange traded fund has two prices at any moment, and only one of them is on the chart.
The first is the net asset value. Add up what the fund owns, subtract what it owes, divide by the number of shares in issue. That is what a share is worth in terms of the assets behind it. For a physically backed gold fund, that is essentially the metal in the vault.
The second is the market price. That is what the last buyer and seller agreed on, on an exchange, in the open market. That is the number the chart draws.
These two track each other closely in a well run fund, and the mechanism that keeps them close is worth understanding: large institutions can create and redeem blocks of shares directly with the fund, so if the market price drifts too far above the value of the assets, it becomes profitable to create new shares and sell them, which pushes the price back down. The same works in reverse.
Closely is not exactly. When the market price sits above net asset value, the fund trades at a premium. Below, and it trades at a discount. Both are normal. Neither shows up on the price chart, because the price chart only ever draws one of the two numbers.
What a share is actually a slice of
It helps to make the underlying concrete, because an abstract claim on an abstract fund is easy to stop thinking about.
The bullion held by physically backed gold funds is normally in Good Delivery form. The London Bullion Market Association, which runs the accreditation, describes a Good Delivery gold bar as approximately 400 troy ounces, meeting its specifications for fine ounce weight, purity, marking and surface quality, produced by a refiner on a list the LBMA owns and maintains.
So the vault holds large, standardised bars, and your share is a fraction of one. If a fund's shares each represent one hundredth of an ounce, a single 400 ounce bar stands behind 40,000 shares. If each share represents a tenth of an ounce, that same bar backs 4,000. Either way, the unit you buy on the exchange is small and the unit in the vault is not, and the fund's paperwork is where that relationship is actually defined.
This is not a niche corner of the market. The World Gold Council's gold ETF data set covers, in its own words, more than 100 physically backed gold ETFs and similar products worldwide. Those products differ in what they hold, where they hold it, what they charge, and how closely their market price tracks their assets. The chart on your platform looks identical for all of them.
The arithmetic of buying at a premium
Here is the part that belongs in the books rather than in a feeling about the chart.
Suppose you buy when the market price is 0.35 per cent above net asset value, and later sell when it is 0.25 per cent below. I want to be clear that those two figures are illustrative inputs chosen to show the calculation, not something I measured on a particular day. What matters is the identity underneath them, and the identity does not depend on the inputs:
Your round trip gives up the premium you paid on the way in, plus the discount you accepted on the way out. 0.35 plus 0.25 is 0.60 per cent. Gold has to rise 0.60 per cent for you to break even, and that is before commission, before the bid and ask, and before the fund's own annual fee has taken anything.
Run the same sum with your own numbers and the structure holds. The cost is additive across the two ends of the trade, it is independent of how far the metal moved, and nothing on the price chart will tell you that you paid it.
The spread the chart does not draw
A price chart plots a single value per period, usually the last traded price. The market has two prices at once, a bid and an ask, and you deal on the wrong side of both.
At a 0.05 per cent bid to ask spread, a round trip costs 0.10 per cent. At 0.10 per cent it costs 0.20. Small, and entirely invisible on a line chart, which is exactly why it is worth writing on the same page as the premium rather than leaving it to be discovered.
Thin trading makes that gap wider, and thin trading is a property of the specific fund rather than of gold. Two funds holding the same metal can present very different dealing costs, and the chart shape will not distinguish them. This is the same category of unbilled cost I worked through in impact cost in trading, arriving through a different door.
What the price chart leaves out when a fund distributes
One more gap, and it runs the other way.
For a fund that pays out income, the price chart understates what holding it returned, because the cash that left the fund as a distribution is no longer in the price. Total return includes those payments. Price return does not. Comparing a price chart against a total return chart is comparing two different questions.
Physically backed gold funds generally do not distribute anything, because metal in a vault produces no income. So for gold specifically the price chart and the total return are close together, and the omission that matters is the one running the other way: the fund's annual fee is paid by selling a little metal, so the assets behind each share shrink slowly over time whether or not the price chart ever shows a down day.
Get the free REX one page trading business plan, the document where rules like checking an instrument's real dealing cost get written down once, instead of being rediscovered on the statement. One email, no spam, unsubscribe anytime.
Get the free business plan →What this does not say
It does not say funds are a poor way to hold gold. For a business that does not want a leveraged position or a vault, they are a reasonable instrument, and the premium and discount mechanism generally works.
It does not say premiums are a scandal. They are the normal consequence of a share trading in a market while its assets sit still, and in a liquid fund they are usually small.
And it does not say you can time them. The point is not to wait for a discount. The point is to know the gap exists, to check it before dealing rather than after, and to record it as a cost of the position in the same place you record every other cost.
Putting it on the books
Three things turn this from an interesting fact into an operating rule.
First, before you deal, look up the fund's own published net asset value alongside the market price, which every fund publishes daily. The difference is your premium or discount for that moment, and it takes about a minute.
Second, write that figure into the trade record at entry and at exit, so the round trip cost appears in your own numbers rather than being quietly absorbed into performance. If you track the metrics that matter for the business, this is one of the inputs, and the key metrics worth tracking are only as good as the costs you feed them.
Third, treat the choice of which fund as a supplier decision rather than a detail, because the dealing cost, the fee and the tracking quality are properties of the provider. That is the same discipline as choosing a broker like a business partner, applied one layer further out.
Frequently Asked Questions
How do I read an ETF chart correctly?
Read it as the market price, which is what buyers paid, and then look up the fund's net asset value separately. The chart alone cannot tell you whether you are buying at a premium or a discount, because it only plots one of the two numbers.
What is the difference between NAV and market price?
Net asset value is what the fund's holdings are worth per share. Market price is what the last trade on the exchange happened at. They are kept close by institutions creating and redeeming shares, but they are not the same number at any given moment.
Is a premium always bad?
It is a cost at the moment you buy, and it is a benefit at the moment you sell. The problem is paying one on entry and giving up a discount on exit, which costs you at both ends. With the illustrative figures above that round trip is 0.60 per cent before anything else.
Does the chart show the fund's fee?
Not as a line item. For a physically backed gold fund the fee is paid out of the assets, so the metal behind each share declines gradually. The chart draws the price, so the effect appears as a slow divergence from the metal rather than as a visible charge.
Why does volume matter when reading an ETF chart?
Because thin trading widens the bid to ask spread, and you deal on the wrong side of it twice. At a 0.05 per cent spread a round trip costs 0.10 per cent, and a chart shape gives no indication of this.
Where did the numbers in this article come from?
The approximately 400 troy ounce Good Delivery bar is from the LBMA's Good Delivery page, and the figure of more than 100 physically backed gold ETFs worldwide is from the World Gold Council's gold ETF data set, both linked above. The 0.60 per cent round trip, the 40,000 and 4,000 shares per bar, and the spread figures are my own arithmetic, using illustrative premium, discount and spread inputs that are stated in the text rather than measured from any particular fund or day.
Where REX Trading Signal Fits
REX Trading Signal is free to follow. The daily record goes up on Telegram with the reasoning written before the trade rather than explained after it, losing days included. There is a free one page business plan for anyone who wants the operating documents in one place, and an optional Kit. Nothing here promises a profit.
A rule about checking an instrument before you commit capital belongs in the document where your operating rules live, which is the one page trading business plan. Impact cost in trading covers the dealing costs that never reach a statement, key metrics every trading business should track is where a cost like this has to land to be managed, and choosing a broker like a business partner applies the same supplier logic one layer closer to home.
About the author. Rex writes REX Trading Signal. He runs the account as a business, which mostly means reading an instrument's documents before its chart, and counting the costs that nobody sends an invoice for. Nothing in this article is a recommendation to trade, and no entry, stop or target discussed should be treated as a signal.
Disclaimer: This article is general educational content about instrument due diligence and dealing costs. It is not financial advice, not investment advice and not a recommendation to buy, sell or use any product, venue, broker, fund or firm. Figures computed here rest on the stated assumptions, which are illustrative and not a description of any real fund or result. Trading carries risk of loss. Only commit capital you can afford to lose.