
How long can a trade stay open is usually asked as a rules question, as though a broker were about to tap you on the shoulder at some point and close it for you. The literal answer is dull: on an ordinary spot or CFD account there is generally no time limit at all. You can hold a position for years. Futures are different because the contract itself expires, but the retail product most people trade will sit there indefinitely.
The useful answer is a different question, and it is an inventory question. A position is stock on your shelf. Stock costs money to hold, whether or not it appreciates, and a business that does not know its holding cost is a business that discovers it at stocktake. So the real question is not how long a trade can stay open. It is how long a trade can stay open before the carrying cost has eaten the reason you opened it.
That one has an actual number, and you can compute it for your own account this afternoon.
What Actually Ends a Position
Four things close a trade, and only one of them is you.
You close it. The intended route, on the rule you wrote down before you entered.
The contract expires. Only for dated instruments such as futures. Spot and CFD positions do not expire, which is a convenience that removes a natural review point.
Margin runs out. Every open position consumes margin, and financing debits reduce your balance every day. A position held long enough can be closed by the accumulation of its own costs, without the market ever reaching the level you were worried about.
The broker's terms intervene. Corporate actions, contract changes, dormancy clauses and instrument delistings all exist in the contract you signed. These are rare and they are worth knowing about rather than planning around.
Notice that three of those four are administrative. Only the first is a trading decision. An operator's job is to make sure the first one happens before any of the others do.
The Cost of Shelf Space, Priced
Let me put a number on the holding cost, and let me build it from a published rate rather than a broker's marketing page.
The base is the risk free rate, because financing a position means borrowing. The Federal Reserve's H.15 release of selected interest rates put the three month US Treasury constant maturity yield at 3.90% per year on its 6 August 2026 observation. To that I am adding a retail markup of 2.00 percentage points, which is a stated assumption rather than a quote, because every firm sets its own and yours is in your contract specification.
That gives 5.90% per year on the full notional value of a long position, which works out at 0.01616% of notional per calendar day.
Those numbers look small, which is exactly the problem with them. Written out over realistic horizons, the same rate is 0.4849% over thirty days, 1.4548% over ninety, and 5.90% over a year. And it applies to the whole position, not to the margin you posted, so a leveraged trader is paying that percentage on a number much larger than the cash in the account.
How Long Can a Trade Stay Open Before the Carry Wins
Now the number worth having. Set the carry against the move you are waiting for.
At 0.01616% per day, a 1% target is entirely consumed after 62 calendar days. A 2% target lasts 124 days. A 3% target lasts 186 days, and a 5% target survives 309 days before financing has swallowed all of it.
Those are the break even horizons. Hold past them and a trade that reached its target has still lost you money, without a single thing going wrong in the market.
How Long Gold Actually Takes
Break even horizons are only half the picture. The other half is how long the market genuinely takes to deliver a move of that size, which is a measurable thing rather than a matter of opinion.
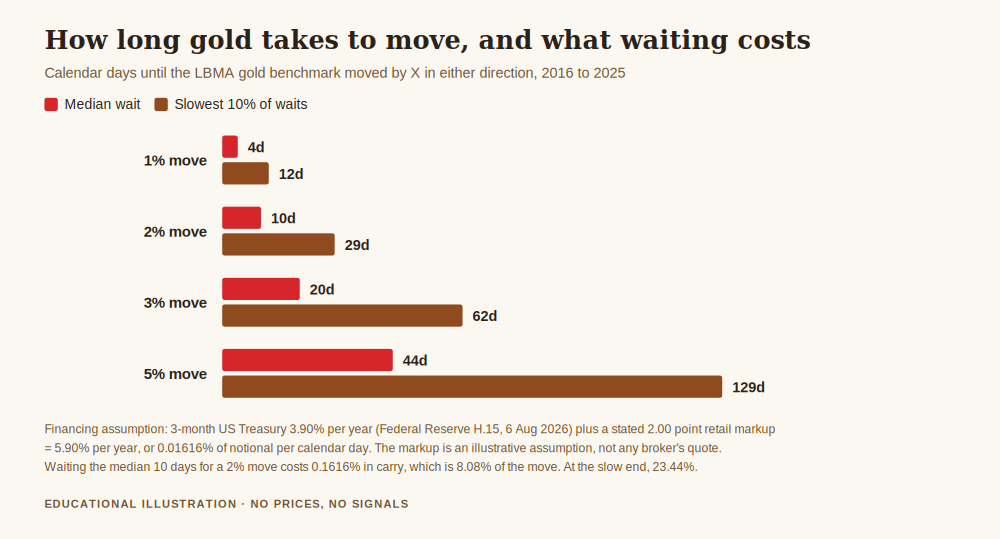
Using the published LBMA gold benchmark across 2016 to 2025, I took every one of the 2,506 daily fixings as a starting point and measured how many calendar days passed before gold moved by a given percentage in either direction.
A 1% move took a median of 4 calendar days, and 12 days for the slowest tenth of cases. A 2% move took a median of 10 days, with the slow tenth at 29. A 3% move took 20 days, slow tenth 62. A 5% move took a median of 44 days, with the slowest tenth running to 129.
Set those two sets of numbers side by side and the picture becomes manageable rather than alarming. You are typically waiting 10 days for a 2% move against a break even horizon of 124 days. The carry is real but it is not the dominant cost at ordinary holding periods, and anyone telling you that overnight financing is what is killing your account is usually pointing away from something else.
What the comparison does establish is proportion. Waiting the median 10 days for a 2% move costs 0.1616% in carry, which is 8.08% of the move you were waiting for. At the slow end, 29 days, it is 0.4688%, or 23.44% of the same move. Roughly a tenth of a normal trade's result goes to holding cost, and closer to a quarter on the slow ones, before you have paid a single spread or commission.
A business that gives away between eight and twenty three percent of its gross margin without recording it anywhere does not have a market problem. It has a bookkeeping problem.
The Cost That Is Not on the Statement
There is a second cost of holding, and it is larger than the financing for most accounts.
Capital in an open position is capital that cannot be used for anything else. If you risk a fixed percentage per trade, every position occupies a slot, and slots are finite. A trade held for sixty days has occupied that slot for sixty days regardless of whether it was ever going anywhere.
The arithmetic of that is worth seeing plainly. Suppose a method returns a positive expectancy of 0.20R per trade and you have roughly 250 trading sessions in a year. Holding each position for 5 sessions gives you about 50 trades and 10R of expected return. Holding for 20 sessions gives 12.5 trades and 2.5R. Holding for 60 sessions gives about 4 trades and 0.83R. Same edge, same risk per trade, and the annual result differs by a factor of twelve purely because of how long each position sat on the shelf.
I want to be careful here, because this arithmetic is very easy to abuse and I do not want it read as an argument for trading more. It assumes the edge survives at the shorter horizon, and usually it does not, since a method built on weekly structure does not become four times better by being forced onto daily bars. It also holds costs constant when in reality more trades means more spread and more commission, which is exactly the trade off worked through in weekly trading vs day trading. What the numbers establish is not that faster is better. It is that holding period is a capital allocation decision with a measurable price, and most traders have never priced it at all.
The Position That Is Really a Decision You Are Avoiding
In practice, the trades that stay open longest are rarely the ones with the longest thesis. They are the ones nobody wants to look at.
The pattern is consistent enough to name. A position moves against you, the original reason for it quietly expires, and closing it would convert a floating loss into a recorded one. So it stays open, and each day it stays open it accrues financing, occupies a slot and consumes attention. It has stopped being a trade and become a way of not making a decision.
The operational fix is not willpower. It is a written expiry on every position, decided before entry, in whichever unit fits your method: a date, a number of sessions, or a condition such as the level that invalidated the idea being reached. When the expiry arrives, the position is reviewed and either re justified in writing or closed. A trade that cannot be re justified is inventory that is not selling, and every other business would mark it down and clear the shelf.
That review is much easier to run if it is part of a routine you already have, which is what the weekly review is for.
Get the free REX one page business plan, the sheet where your risk ceiling, your costs and your holding period live together, so a position has an expiry before it has a profit. One email, no spam, unsubscribe anytime.
Get the free business plan →Frequently Asked Questions
Is there a maximum time a trade can stay open?
On an ordinary spot or CFD account, generally no. Positions roll indefinitely and there is no built in limit. Dated instruments such as futures do expire, and every account is subject to margin requirements and to the broker's terms, so in practice a position ends when you close it, when margin runs out, or when the contract or the contract terms end it.
What does it cost to hold a position overnight?
The economic floor is the financing rate. Using the published three month US Treasury yield of 3.90% plus an assumed 2.00 point retail markup, that is 5.90% per year, or 0.01616% of the position's notional value per calendar day. Your actual rate is set by your broker and is in your contract specification, and it applies to the full notional rather than to your margin.
At what point does the financing cost more than the trade is worth?
At that assumed rate, a 1% target is fully consumed after 62 calendar days, a 2% target after 124, a 3% target after 186 and a 5% target after 309. Those are break even horizons, so a position held beyond them can hit its target and still lose money.
How long does gold usually take to move?
Measured on the LBMA benchmark from 2016 to 2025, a 1% move took a median of 4 calendar days, 2% took 10 days, 3% took 20 days and 5% took 44 days. The slowest tenth of cases took 12, 29, 62 and 129 days respectively. Those are moves in either direction, not favourable ones.
Does holding longer mean more risk?
It means more exposure to events and more accumulated financing, but not necessarily more risk per trade, since that is set by your position size and your invalidation level. The clearer effect is on capacity: a position held for sixty sessions occupies a slot for sixty sessions, which caps how many opportunities your capital can take in a year.
Should I close trades before the weekend?
That is a decision about gap risk and about your own rule, not a general instruction. What is worth knowing is that financing is normally charged on calendar days rather than trading days, so a weekend is typically carried whether or not the market is open, and many firms apply a multiple on one weekday to account for it. Check which day yours uses.
Is a long hold a sign of patience or of avoidance?
The test is whether you can still state the reason for the position in one sentence, and whether that reason is the one you wrote down at entry. Patience is holding a valid idea through time. Avoidance is holding an invalid one because closing it would make the loss real, and it is worth checking which one you are doing on any position that has outlived its thesis.
Where This Leaves You
The honest answer to how long can a trade stay open is that the market will let you hold it more or less forever, and that this is a liability rather than a feature. No deadline means no forced review, and no forced review is how a decision gets postponed for months at 0.01616% a day.
Three things to put in place, none of which require new tools. Find your actual financing rate for a long position and write it in your plan next to your spread and commission. Give every position a written expiry at entry, in days or in conditions, so the review happens on schedule rather than on mood. And count what a slot costs you, because the trade quietly occupying capital for two months is competing with every trade you did not take while it sat there.
The framework this sits in is the one page trading business plan template. The per trade economics are in the trading business model, and the full cost base it belongs to is in fixed and variable costs of a trading business.
About the author. Rex writes REX Trading Signal. He treats an account as a small business with costs, capacity and a set of books, on the view that most trading problems turn out to be operational once someone bothers to write the numbers down.
Disclaimer: This article is general educational content about the cost of holding a position. It is not financial advice, not tax or legal advice, and not a recommendation of any instrument, broker, holding period or trading rule. Trading gold, CFDs and leveraged products carries a high risk of losing money rapidly. No entry, stop or target discussed should be treated as a signal. The 3.90% base rate is the published three month US Treasury constant maturity yield from the Federal Reserve H.15 release dated 6 August 2026; the 2.00 percentage point markup added to it is an illustrative assumption and not a rate offered by any firm, so your own financing cost will differ and is set out in your contract specification. The holding period figures are computed from the published LBMA daily gold benchmark over 2016 to 2025, measure moves in either direction rather than favourable ones, describe how that public benchmark behaved in the past and are not a forecast. The expectancy and capital velocity arithmetic is a stated worked example assuming the edge holds at every horizon, which in practice it usually does not, and it is not a claim about achievable returns. No price levels are quoted anywhere in this article and no real trading results are represented.