
A screenshot lands in your inbox. Seven wins, one loss, one entry missed, and a number at the bottom with a plus sign in front of it. The question you are really being asked is whether to route capital toward whoever produced it, so the question worth asking back is how many trades do you need to judge a strategy. Most people answer it with a feeling. The arithmetic gives a different answer, and it is a long way from eight.
This is a supplier evaluation. You are deciding whether a process, yours or somebody else's, deserves an allocation of working capital. No other business approves a supplier on one week of invoices, and a trading business should not either. Nothing below is a view on any particular strategy or service. It is the sample size question, with the numbers computed.
How many trades do you need to judge a strategy, and why eight is not a number
Start with the least flattering possible assumption and see what it can produce. Take a system with no edge at all: it wins half the time, loses half the time, the wins and losses are the same size, and each trade is independent of the last. A coin, in other words, dressed as a method.
Run that coin for eight trades. The probability it produces seven wins or better is 9 out of 256, which is 3.52 per cent. The probability it goes a perfect eight for eight is 1 in 256, or 0.39 per cent.
Three and a half per cent sounds small until you count the people it applies to. Out of a thousand traders with genuinely no edge whatsoever, about 35 can honestly screenshot a week of seven wins from eight. They are not lying. They did not fake the record. The coin simply did what coins occasionally do, and the 965 who had an ordinary week posted nothing at all.
That last clause is the whole problem. You are not seeing a random sample of weeks. You are seeing the weeks that were worth posting, selected after the fact by the people who had them. A perfect week is evidence of having had a perfect week. On its own it is not yet evidence of a method.
The number nobody puts next to the win rate
Suppose you are more careful than that. You do not judge on one week. You track an actual record and you find a win rate of 60 per cent. The question is what that 60 per cent entitles you to believe, and the answer depends entirely on how many trades it came from.
A confidence interval answers exactly that. It is the range the true long run rate could plausibly sit in, given what you observed. Assuming independent trades and using the normal approximation, here is how wide the doubt stays.
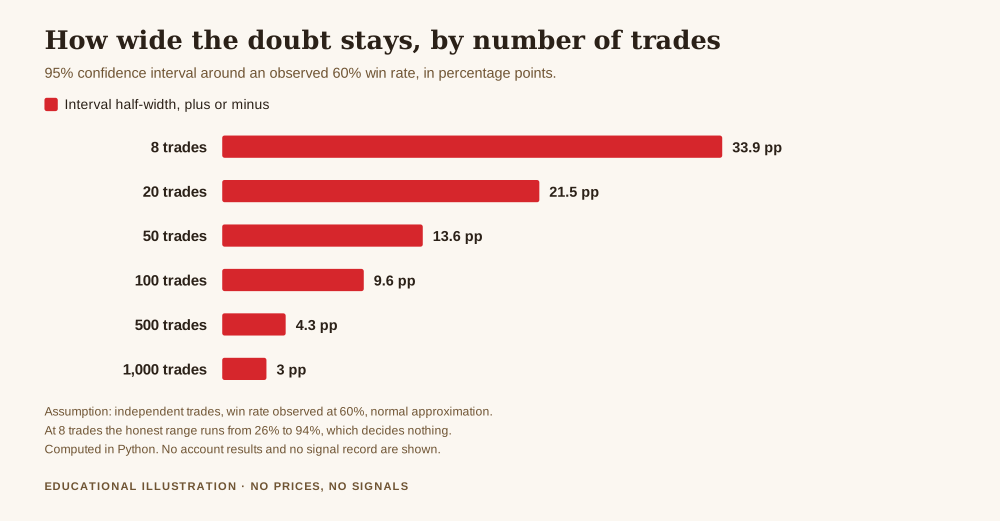
At 8 trades, an observed 60 per cent carries an interval of plus or minus 33.9 percentage points. The true rate could plausibly be 26 per cent or 94 per cent. That range contains both a catastrophe and a fortune, which means it decides nothing at all.
At 20 trades it is plus or minus 21.5 points. At 50 it is 13.6. At 100 trades it is plus or minus 9.6 points, so the honest statement is somewhere between 50.4 and 69.6 per cent, and only at that point does the range finally clear the coin flip. At 500 trades it is 4.3 points, and at 1,000 it is 3.0.
Notice how slowly it improves. Going from 8 trades to 100 is more than a tenfold increase in work and it only cuts the doubt by about three quarters. The interval narrows with the square root of the sample, which is why there is no clever shortcut here and why patience is the only mechanism available.
What it takes to separate a real edge from a coin
Two thresholds are worth committing to memory, both computed on the same assumptions.
To pin an approximately even win rate down to within plus or minus 5 percentage points at 95 per cent confidence takes about 384 trades. That is just to measure it, not to prove it beats anything.
To actually distinguish a 55 per cent system from a 50 per cent system, at 95 per cent confidence with an 80 per cent chance of detecting the difference if it is really there, takes roughly 784 trades. At two trades a day that is about 18.7 months of trading.
Sit with that for a second, because it reframes nearly every claim you will ever be shown. A genuine, real, money making five point edge takes something like a year and a half of consistent execution before the record alone can tell it apart from luck. Anybody presenting a conclusion after a week is not presenting a conclusion. They are presenting a week.
This is also the honest answer to why your own results feel so hard to read. You are not failing to interpret them. There is genuinely not enough information in them yet.
What readers actually say about this
Roughly 258 messages in my inbox touch on trust and deciding whether a channel or a method is legitimate. That is a keyword count across the messages I have, not a survey, so treat it as a rough indication of how often the subject comes up rather than a measurement of anything.
The pattern in them is consistent. One reader wrote: "I can trust you coz your signals are very good been following you since past 4months." Four months is a real amount of time. It is usually not yet a real amount of evidence, and the gap between those two things is where the money goes.
Another put the short version of the same mistake more starkly: "First time it got profit then I trust and deposit 2 to 3 times..and lost entire capital." The first result did the persuading. The sample size did the rest.
A third wrote simply: "One last thing this is legit right? I dont want to lose more." That question cannot be answered by a track record short enough to read in one sitting, which is uncomfortable, because a short record is usually all anybody is offered.
And one reader, asked how long they had been at it, answered: "About 3 or 4 years. To be honest, I've pretty much lost money the whole time." That is a large sample and an unwelcome conclusion, and it is worth more than any perfect week, because at that length the number means something.
Why the rulebook forces a disclaimer onto simulated results
This is not a niche statistical worry. It is written into regulation.
Under 17 CFR 4.41, nobody may present simulated or hypothetical performance without attaching a prescribed statement, which says among other things that such results "do not represent actual trading" and that "Simulated or hypothetical trading programs in general are also subject to the fact that they are designed with the benefit of hindsight."
The same rule covers testimonials. If an advertisement quotes a happy client, it must prominently disclose that the testimonial "may not be representative of the experience of other clients" and that it "is no guarantee of future performance or success," and must say so if the testimonial was paid for.
Read those two requirements together and you have a regulator describing, in careful language, exactly the problem this article is about. The satisfied customer and the glowing backtest are both small samples chosen after the outcome was known. The rule does not ban them. It forces the limitation to be printed next to them, because the limitation is not obvious and the number is persuasive.
Get the free REX one page business plan, the document where a review date and a minimum sample size live so they survive the week you most want to ignore them. One email, no spam, unsubscribe anytime.
Get the free business plan →Putting it on the books
None of this is useful as an attitude. It is useful as a written rule, decided before you are holding a screenshot and feeling something about it.
Four lines are enough. Write down the minimum number of trades before you will draw any conclusion about a method, and set it in the hundreds rather than the tens. Write down the review date that follows from that number at your actual trading frequency. Write down the size you will allocate during the evaluation, small enough that being wrong for 784 trades is survivable. And write down what result would make you stop early, which should be about risk behaviour and rule breaches rather than a run of losses, because a run of losses is the one thing a small sample genuinely does produce.
Those four lines belong in the one page trading business plan, not in your memory, for the same reason every other business writes down its supplier terms. The moment you need the rule is the moment you least want to apply it. Related reading sits in overfitting, which is what happens when you let a small sample pick your settings, and in the metrics a trading business should track.
What this article does not say
It does not say that a good week means nothing. It means something. It just means much less than its emotional weight suggests, and it cannot carry a decision on its own.
It does not say you must take 784 trades before using any method. You have other evidence: whether the logic makes sense, whether the risk per trade is controlled, whether the person showing you the record also shows you the losing days. Sample size is one input among several, and it is the one most often left out.
It does not say the maths above is the whole story. Real trades are not perfectly independent, wins and losses are not the same size, and market conditions shift underneath you, all of which generally make the required sample larger rather than smaller. The figures here are a floor, not a ceiling.
And it does not tell you to trade anything. It tells you what a number is worth before you act on it.
Frequently Asked Questions
How many trades do you need to judge a strategy, in one line?
To measure an approximately even win rate to within plus or minus 5 percentage points takes about 384 trades, and to tell a 55 per cent system apart from a 50 per cent one with reasonable confidence takes roughly 784. Anything under about 100 trades leaves a range too wide to decide on.
Someone showed me seven wins from eight. Is that good?
It is a good week. A system with no edge at all produces seven or better from eight about 3.52 per cent of the time, so out of a thousand edgeless traders around 35 can show you that honestly. You are also only being shown the weeks worth showing, which makes the figure weaker than it looks.
Why does the confidence interval shrink so slowly?
It narrows with the square root of the number of trades, so cutting the doubt in half takes four times the sample. That is why going from 8 to 100 trades only reduces the interval by about three quarters, and why there is no shortcut.
Does a long losing run mean the method is broken?
Not by itself, and this is the mirror image of the same error. Small samples produce streaks in both directions. A stop rule based on risk behaviour and broken rules is more reliable than one based on a run of results.
Where did these numbers come from?
The 9 in 256, the 3.52 per cent, the confidence intervals, the 384 and the 784 are my own calculations, assuming independent trades, equal win and loss sizes and the normal approximation for the intervals. The disclaimer and testimonial wording is quoted from 17 CFR 4.41, linked above and checked on 28 October 2026. The reader quotes are real messages, anonymised, counted by keyword rather than surveyed.
Where REX Trading Signal Fits
REX Trading Signal is free to follow. The daily record goes up on Telegram with the losing days included, because a record with the bad days removed is exactly the small biased sample this article is about. There is a free one page business plan for anyone who wants the operating rules in one document, and an optional Kit for people who want the full system. Nothing here promises a profit and nothing here is a signal service.
About the author. Rex writes REX Trading Signal. He runs the account as a business, which mostly means a supplier gets a sample size and a review date rather than a leap of faith. Nothing in this article is a recommendation to trade, and no entry, stop or target discussed should be treated as a signal.