
A reader wrote to me in September asking which journal software he should buy. He had a shortlist of three, a free trial running on two of them, and he wanted me to break the tie. I asked him one question first: what decision are you going to make with it? He did not have an answer, and that is the real reason the question what is the best trading journal is so hard to settle. It is being asked as a question about software when it is a question about bookkeeping.
A trading account is a business. Businesses keep books, and nobody asks which accounting software is best without first knowing what the accounts have to produce. So this article answers it the way a business owner would: what the records must contain, what you need before they can tell you anything, and only then which format is sensible.
Everything numerical here is my own calculation from assumptions I write out, apart from one published study I have sourced and linked. Nothing here is financial advice.
What is the best trading journal? The one your books can be audited from
Start with the purpose, because it decides everything else. A set of trading books has three jobs, and they are not the same job.
Record. What happened, in enough detail that a stranger could reconstruct the trade without asking you. This is the part most people do adequately.
Compute. Turn the record into numbers that mean something: expectancy, average win against average loss, cost per trade, results grouped by setup, by session, by day of the week. This is the part most journals fail at, usually because a field was never captured and cannot be recovered.
Review. Sit down on a schedule and let the numbers change a policy. Without this step the first two are a diary.
A journal that can do all three is a set of books. One that can only do the first is a scrapbook of screenshots, and no amount of software fixes that.
The uncomfortable arithmetic nobody mentions when selling you a journal
Here is the part that changes how you should think about this.
Suppose you want to know your win rate. Not feel it, know it. You have thirty trades recorded and nineteen of them are winners, so you tell yourself your win rate is about 63 per cent. How confident should you be in that?
Treat each trade as an independent draw and the width of a 95 per cent interval around an observed rate is roughly 1.96 times the square root of p times one minus p, divided by the number of trades. Put p at 0.50, which is the most cautious assumption because it makes the interval as wide as it can be, and the arithmetic is unforgiving:
- After 20 trades, plus or minus 21.9 percentage points.
- After 30 trades, plus or minus 17.9 points. Your "63 per cent" is somewhere between 45 and 81.
- After 50 trades, plus or minus 13.9 points.
- After 100 trades, plus or minus 9.8 points.
- After 385 trades, plus or minus 5.0 points.
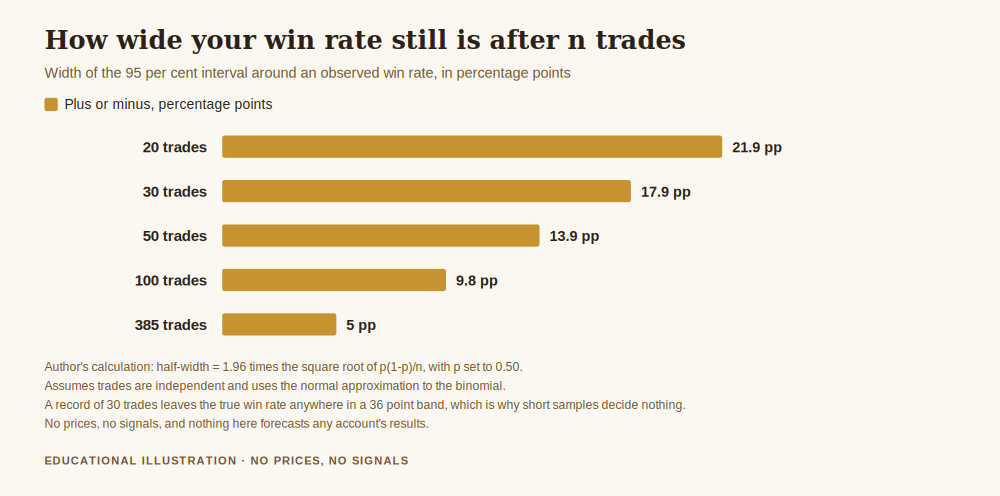
Those are my calculations, assuming independent trades and the normal approximation to the binomial. The practical consequence is blunt. To pin your win rate down to plus or minus five points you need about 385 trades. At three trades a week that is 128 weeks, roughly two and a half years. At five a week it is about 18 months.
So the single most important property of a trading journal is not its interface. It is whether you will still be filling it in two years from now, with the same fields, in a form you can still read. Every other criterion is downstream of that.
What the records showed that the traders could not see
There is a well known piece of evidence for why records beat recollection, and it exists only because the records existed.
Brad Barber and Terrance Odean examined the actual accounts of 66,465 households at a large discount broker between 1991 and 1996, in a paper published in The Journal of Finance under a title that gives away the finding: Trading Is Hazardous to Your Wealth. The identifier is 10.1111/0022-1082.00226, which I verified against the Crossref record before citing it.
The households that traded most earned an annual return of 11.4 per cent while the market returned 17.9 per cent, and the average household earned 16.4 per cent while turning over 75 per cent of its portfolio a year. The gap between the most active group and the market is 6.5 percentage points, my subtraction.
Note what made the finding possible. Not a survey, not what anybody remembered about their own trading. Account records. Those households did not know they were trading themselves out of a return, and not one of them could have discovered it from memory. That is the argument for keeping books, and it is a stronger one than any productivity pitch.
The caution worth stating: this is equities over a particular period, not leveraged gold, so treat it as evidence that activity carries a measurable cost rather than as a figure that applies to your account.
The four formats, judged as bookkeeping
Now the comparison, with the criteria set by the three jobs above rather than by feature lists.
Your broker statement. Free, complete and unarguable on everything that touches money: entry, exit, size, commission, swap. It is also the only record you did not write, so it cannot be fudged after a bad day. What it cannot hold is why you took the trade, which is exactly the column that makes the rest useful. Treat it as the general ledger, and reconcile against it rather than replacing it.
A spreadsheet. Unfashionable and still the best answer for most people. It costs nothing, it computes anything, it exports forever, and nobody can take it away or change its pricing. The weakness is friction: you are typing numbers a platform already knows, and friction is what stops people at trade 40 of 385.
A notes app, Notion or similar. Excellent for the narrative column and poor at arithmetic. If your review is mostly reading back what you were thinking, this is pleasant. If you want results grouped by setup, you will be doing it by hand. Many people end up running this alongside a spreadsheet, which works as long as one of them is the system of record.
Dedicated journal software. Imports from the platform, which solves the friction problem, and computes the statistics for you, which solves the arithmetic problem. Two cautions, both of them business ones. First, it is a subscription, so price it per year against what it changes about your decisions. Second, ask how you get your data out. A journal you cannot export is a set of books held by somebody else, and over the two and a half years it takes to reach a meaningful sample, that is a real operational risk.
The fields that decide whether any of this works
Whichever format you pick, these are the columns that let the computing step happen. Miss one and you will discover the gap at review, by which time the trades are gone.
- Date and time, including session. London and New York behave differently, and you cannot split your results by session later if you never wrote it down.
- Instrument and position size. In lots, not in money.
- Risk in R, decided before entry. The single most useful field on the sheet, because it makes trades of different sizes comparable.
- Result in R. Not in currency. Currency results from two different account sizes cannot be averaged honestly.
- Costs actually charged. Spread, commission and swap, taken from the statement rather than estimated.
- The setup name, from a closed list. Free text here destroys your ability to group, and grouping is the entire point.
- Whether it followed your rules, yes or no. This one column is worth more than the screenshots. It lets you separate a bad outcome from a bad decision, and they are not the same thing.
- One line on the reason, written before the outcome is known. Written afterwards, it is a story.
That is eight fields. At roughly two minutes a trade, 385 trades costs you about 12.8 hours of typing spread over two years, my arithmetic. That is the real price of knowing whether your method works, and it is cheap.
The test I would actually apply
If you want the question settled, here is the test, and it takes a fortnight rather than a trial month.
Pick the format you are least likely to abandon. Record every trade for two weeks with no exceptions, including the ones you are embarrassed by, because a journal with the bad trades missing is worse than no journal at all: it reports a version of you that does not trade. At the end of the fortnight, try to answer three questions from your own records alone: what is my average result in R, which setup is carrying the account, and how many trades broke my own rules.
If you can answer all three in ten minutes, the format is good enough. Keep it for two years and let it accumulate. If you cannot, the problem is a missing field, not the software, and switching tools will not fix it.
That is the honest answer. The best trading journal is the one that still has every trade in it when you finally have enough of them to learn something, and the one you will still be using when that day arrives.
Get the free REX one page business plan, the sheet I use to run an account like a business, including the review schedule that turns a journal into a decision instead of a diary. One email, no spam, unsubscribe anytime.
Get the free business plan →Frequently asked questions
What is the best trading journal for a beginner?
A spreadsheet with the eight fields listed above, reconciled against your broker statement. It costs nothing, it computes anything, it exports forever, and it removes the risk of paying a subscription for two years before finding out whether you will keep the habit. Move to dedicated software when the typing, not the price, is what is stopping you.
How many trades before my journal tells me anything?
More than people expect. On my calculation, assuming independent trades and a true rate of 50 per cent, 30 trades leave the 95 per cent interval around your win rate at plus or minus 17.9 percentage points, and you need about 385 trades to narrow it to plus or minus five. At three trades a week that is roughly two and a half years.
Is journal software worth paying for?
Price it as a business expense against what it changes. If automatic import is the difference between recording every trade and recording the memorable ones, it is cheap, because an incomplete record is the one failure that cannot be repaired later. Before subscribing, check how you export your data, since you will be accumulating it for years.
Should I record results in money or in R?
In R, meaning multiples of the risk you decided before entry. Currency results from different account sizes and different position sizes cannot be averaged honestly, so a sheet kept in money quietly reports your sizing rather than your method. Keep the money column too, for costs and tax, but review in R.
What is the one field people forget?
Whether the trade followed your own rules, recorded as a plain yes or no. Without it you cannot separate a bad outcome from a bad decision, and those need opposite responses: one is variance you should ignore, the other is a process problem you should fix.
Do screenshots belong in a trading journal?
They are useful and they are not the books. A screenshot cannot be summed, sorted or grouped, so it supports the review step while contributing nothing to the computing step. Keep them, and keep the numeric fields separately.
Where REX fits
REX Trading Signal is a free journal about running a trading account the way you would run a business, with books, costs, policies and an operating manual. Everything here is free to read. The one optional piece is the one page business plan above. I do not promise profits, I do not sell a method, and I do not think anyone can tell you what your account will do. The piece this one hangs off is the one page trading business plan, and the records described here are what feed it. The companion pieces are how to keep a trading journal like a professional and the key metrics every trading business should track.
About the author. Rex writes REX Trading Signal and treats an account as a business with books, costs and an operating manual. He kept three journals in his first two years and abandoned all of them, which is why he now judges a journal by whether it will still be running in year three rather than by what it can display in week one. Nothing here is financial advice, and no entry, stop or target discussed should be treated as a signal.