
Every business has two sets of numbers: where activity happened, and where revenue happened. They are not the same, and confusing them is how a company convinces itself a busy quarter was a good one. Trading with market profile is the chart equivalent of insisting on the second number. It asks where the market actually did business, not where the price managed to travel.
That is a genuinely useful question and it deserves a straight answer rather than a mystique. So this article does two things. It explains the idea in plain words, and then it measures the idea on twenty-six years of published gold benchmark data, including the part that does not flatter it.
Trading With Market Profile, the Idea in One Paragraph
The thinking behind it came out of the Chicago futures pits in the 1980s, and it starts from an unglamorous premise: a market exists to facilitate trade. Price is only the advertisement. If the advertisement is working, the market lingers there and business gets done. If it is not working, the market leaves quickly and almost nothing changes hands on the way.
So instead of drawing price against time as a line, you count how much time the market spent at each price. Stack those counts sideways and you get a distribution, usually fat in the middle and thin at both ends. The fat middle is where business happened. The convention is to take the narrowest band holding about seventy per cent of the activity and call it the value area, and to call the single busiest price the point of control. The thin ends are prices the market advertised and rejected.
For someone running an account as a business, the appeal is obvious. It is an inventory view of the market. Instead of asking what price is doing, you are asking where the counterparties are, which is much closer to the question that decides whether your order gets filled at a sensible number.
What I Could Measure, and What I Could Not
Here is the honest methodology, because this section is what separates a measurement from a claim.
A true market profile is built from intraday data, traditionally in thirty minute brackets through a session. I do not have a clean, public, auditable intraday record for gold. What I do have is the London Bullion Market Association gold auction history, a formal benchmark price set each working day, published in full and free for anyone to download and check. That gives one print per day, which is far coarser than a real profile.
So what follows is the same arithmetic at daily resolution. For every calendar month from January 2000 to August 2026 with at least fifteen auction days, which is 320 months, I took that month's prints, found the narrowest price band containing seventy per cent of them, and measured it as a percentage of the month's median price. Then I asked how much of the next month landed back inside it.
What this can answer: how wide the area of business tends to be, how much of a month's range it occupies, and how durable it is from one month to the next. What it cannot answer: anything about a session, a bracket, an intraday point of control, or what happened between two daily prints. Anyone who tells you a daily series can produce a real profile is selling something. This is the family resemblance, not the thing itself.
How Wide Is the Area Where Business Actually Gets Done
Across those 320 months the seventy per cent value area had a median width of 2.67 per cent of the month's median price. Half of all months fell between 1.93 and 3.95 per cent. The narrowest month in twenty-six years measured 0.58 per cent. The widest measured 17.38 per cent.
That last pair is worth sitting with for a second, because it is a factor of thirty between the calmest month on record and the wildest. Any rule of thumb that treats "normal noise" as a fixed number is going to be wrong most of the time, and wrong in both directions.
The more interesting number is what share of the month the value area covers. Median answer: the band holding seventy per cent of the prints covers 52.8 per cent of the month's full high to low range.
Turn that around. Roughly half of every month's range is territory the market visited but did not do much business in. It is travel, not trade. Meanwhile, 54.0 per cent of all daily prints in the sample sat within one per cent either side of their month's median, and the single busiest quarter per cent slice of price, measured relative to the month's median, held 10.46 per cent of all prints by itself.
For an owner, that is the whole argument for the technique in one line. Half the chart is advertising. The other half is revenue.
The Part That Should Change How You Use It
Now the awkward measurement, and the reason this article is not a sales pitch.
If the value area described something stable about where the market wants to do business, it should keep working for a while. It does not. Of the next month's prints, a median of only 27.3 per cent landed back inside the previous month's value area. In 34.8 per cent of month pairs, fewer than one print in ten came back. Only in 24.8 per cent of pairs did more than half the next month return.
And the blunt version: in 220 of 319 consecutive month pairs, which is 69.0 per cent, the next month's median price sat completely outside the previous month's value area. Seven times out of ten, the business relocated.
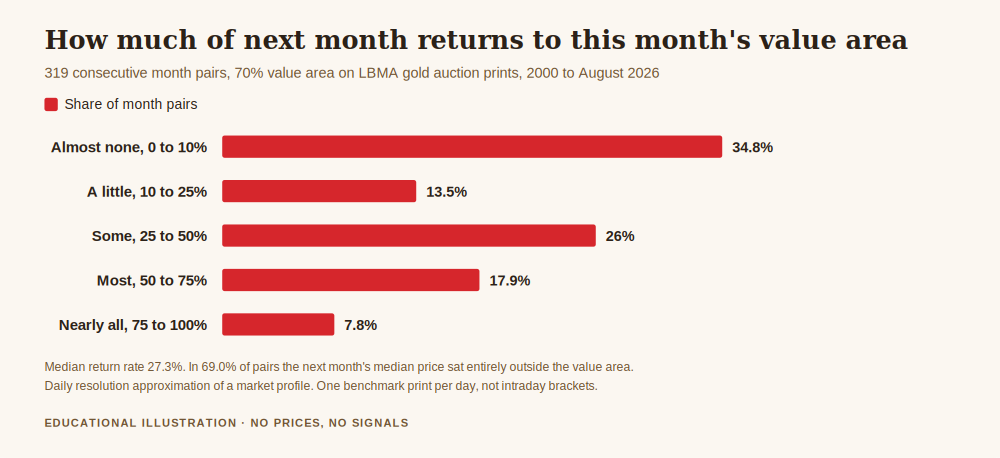
This is not a flaw in the idea. It is the idea. A value area is a description of where trade was facilitated during a period that has now ended. Auction market theory does not claim the area persists; it claims that when price leaves the area and stays away, the market is repricing, and when price leaves and comes straight back, it is not. What the measurement kills is the lazy version of the technique, the one that treats last month's shaded box as a set of levels that will hold.
Which is exactly the failure mode a business owner should recognise. Last year's revenue by region is a real and useful number. It is also not next year's forecast, and nobody sensible runs the business as though it were.
Get the free REX one page trading business plan, the sheet where your risk limit, your review schedule and the measurements you actually trust live together instead of in your head. One email, no spam, unsubscribe anytime.
Get the free business plan →Three Things an Owner Can Do With This, and One They Cannot
One, calibrate what counts as noise. If the area of business in a typical month is a couple of per cent wide, then a move of a fraction of a per cent is not information, it is the market breathing. That is a sizing input and a patience input. It has nothing to do with direction, and it is the least glamorous and most valuable thing on this list.
Two, treat a relocation as a trigger for review, not for reaction. When price leaves the band where business has been done and stays out, something in the operating environment has changed. A business would not respond by trading larger. It would respond by rereading its assumptions, which in this context means the work described in how to review the trend like a business owner.
Three, use it as vocabulary in the weekly review. "Price rejected the high" is a story. "Almost no business was done above this level and the market came back inside within a day" is an observation you can check later against the record. The first one feels better. The second one is the one worth writing down, and it belongs in the weekly review next to the numbers.
And the thing it cannot do: generate entries. Nothing above tells you to buy anything anywhere. The measurement showing 69.0 per cent relocation is precisely the evidence that a value area boundary is not a level to lean on. Used as a signal generator it will hand you a beautiful, well-reasoned story for a trade the market has already stopped agreeing with.
What This Does Not Say
It does not say the London auction is your broker's price, or that a benchmark set once a day is equivalent to a trading session. The auction is used here because it is public, auditable, and free of anyone's marketing, which makes it a fair yardstick and a poor substitute for a tick feed.
It does not say the classic intraday version of the technique would produce these same numbers. It might produce tighter areas and higher persistence over shorter horizons, and testing that properly needs data I have not got. Treat the monthly figures as the outer, coarsest version of the question.
It does not predict anything. Twenty-six years of measurement describes what happened. The right use of a distribution is to size against it, never to forecast with it.
And it is not a strategy. There is no entry rule, no exit rule and no level anywhere in this article, deliberately.
Frequently Asked Questions
Is trading with market profile a strategy or a lens?
A lens. It reorganises information you already have into a distribution of activity. Every strategy decision, what to risk, when to act, when to stop, still has to be made separately, and the 69.0 per cent relocation rate measured above is a good reason not to bolt entries onto it casually.
What is the value area, in plain words?
The narrowest band of price containing about seventy per cent of the period's activity. On the gold benchmark, measured monthly, that band had a median width of 2.67 per cent of price and covered a median 52.8 per cent of the month's total range.
What is the point of control?
The single price at which the most activity happened, the peak of the distribution. In this daily approximation, the busiest quarter per cent slice relative to the month's median held 10.46 per cent of all prints.
Does the value area act as support and resistance?
Not reliably, on this evidence. A median of 27.3 per cent of the following month's prints returned inside it, and in 34.8 per cent of month pairs fewer than one print in ten came back. It describes a period that has ended.
Do I need special software?
For a real intraday profile, yes, some charting packages build them. For the use described here, which is calibrating what counts as noise and noticing when business relocates, a spreadsheet and the published price history are enough.
Where did the numbers in this article come from?
All of them were calculated from the published LBMA gold auction history linked below, downloaded before publication. The method is to take each calendar month from 2000 onward with at least fifteen auction days, find the narrowest band containing seventy per cent of that month's prints, express it as a percentage of the month's median price, and then count how many of the following month's prints fell inside it. None of it is a price quote, a forecast or a performance claim.
Where REX Trading Signal Fits
REX Trading Signal is free to follow. Daily XAUUSD analysis with the reason and the risk stated before the trade, losing days included, on Telegram. There is a free one page business plan for anyone who wants the operating material in one place, and an optional Kit for people who want the full method. Nothing here promises a profit, and nothing here is a signal service.
A measurement is only worth having if it lands in the plan. The one page trading business plan template is the pillar this article sits under, what is price action trading is the neighbouring lens and has the same limits, and key metrics every trading business should track covers the numbers that belong next to this one. The price history comes from the London Bullion Market Association price record. More about who writes this is on the about page.
About the author. Rex writes REX Trading Signal and looks at an account the way an owner looks at a set of books, which includes testing the techniques he likes rather than the ones he does not. He would rather publish the number that weakens his case than find out about it later. Nothing in this article is a recommendation to trade, and no entry, stop or target discussed should be treated as a signal.
Disclaimer: This article is general educational content about market structure, distribution measurement and review process in retail trading. It is not financial advice, not investment advice and not a recommendation to trade or to use any firm, product or software. Market conditions change, and measurements of the past do not describe the future. Trading leveraged products carries a substantial risk of loss and most retail accounts lose money. Figures are calculations from the stated public data and stated assumptions, not predictions or performance claims.