
Trading following the trend strategy is the approach most people arrive at second. The first approach is usually catching turns, which fails in an obvious way. Following the trend fails in a much less obvious way, and the reason it catches out business owners rather than beginners is that it does not fail on the profit and loss statement at all. It fails on the cash flow statement.
So let me do this the way I would look at any other business I was thinking of running: what does the revenue actually look like, month to month, and can the operation survive the gaps between the good months. Not whether the method works. Whether the business built on it is fundable.
What trading following the trend strategy actually pays, measured on gold
Start with the market rather than with a system, because the shape comes from the market and no amount of system design removes it.
I took the afternoon gold benchmark published by the London Bullion Market Association, in US dollars, every day from 1 January 1975 to 24 September 2026. Then I applied about the crudest trend definition available: is price above or below its own 200 day average. Every time it crosses, that is a new regime. Over fifty one years there were 417 of them.
The median regime lasted 3 trading days. The mean lasted 31. The longest ran 728 trading days, from January 2009 to December 2011.
A median of 3 and a mean of 31 is not a distribution with a middle. It is a pile of noise with a few enormous outliers sitting on top of it, and that gap between the median and the mean is the entire subject of this article.
Eight per cent of your signals are the business
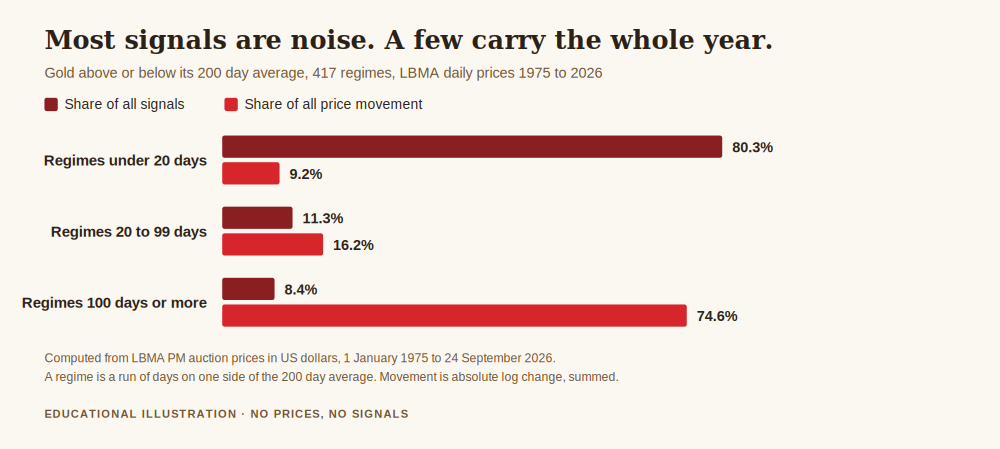
Break those 417 regimes into three buckets and measure how much of gold's total price travel happened inside each.
Regimes lasting under 20 trading days are 80.3 per cent of every signal the definition produced. They contain 9.2 per cent of all the movement. Four out of every five times this method told you something had changed, it was pointing at almost nothing.
Regimes of 100 trading days or more are 8.4 per cent of the signals. They contain 74.6 per cent of the movement. Take the largest tenth of regimes by distance travelled and you have 79.6 per cent of everything gold did in fifty one years, produced by 41 episodes.
Any business would recognise this immediately, because it is the customer concentration problem. Four fifths of your enquiries are worth nothing. A twelfth of them are the entire year. You cannot tell which is which at the time, you have to service all of them to catch any of them, and the cost of servicing the worthless ones is charged in real money.
That last part is what people miss when they picture trend following as patient and cheap. It is not patient at all. It generates signals constantly, and it pays a full round turn in costs on the 335 that go nowhere in order to still be holding when one of the 35 arrives.
What that shape does to a month, and to a year
Now the part a business owner actually needs, which is the revenue schedule. I simulated it rather than guessed at it.
Here are the assumptions, and I want to be blunt about the most important one. I gave the system a positive edge by construction: 35 per cent of trades win and pay 3 planned risks, 65 per cent lose and cost 1 planned risk. That works out to plus 0.40 planned risks per trade. I am not claiming any real system has that. I assumed it, deliberately and generously, because the point of this exercise is what the revenue looks like even when the method genuinely works. Four trades a month, sixty months, twenty thousand runs, fixed random seed 20260925 so anyone can repeat it.
With a genuinely profitable method, over five years, here is what the calendar looked like.
- The median run had 57 per cent of its months at or below zero. In the unluckiest tenth of runs it was 65 per cent, and even in the luckiest tenth it was 48 per cent.
- The longest stretch of consecutive months without a gain was typically 6. One run in ten had a stretch of 9 or worse. The worst run in twenty thousand went 26 months without a positive month, and still finished the five years ahead.
- The deepest peak to trough decline was 12 planned risks in the median run and 16 in the unluckiest tenth.
- The best 10 per cent of all trades produced 29 per cent of the gross winnings.
Read the first bullet again. A method with a real edge, run properly for five years, still loses money in the majority of its months. Not occasionally. As the normal condition. The profit arrives in a minority of months that are large enough to pay for all the others.
That is not a warning about a bad strategy. That is the arithmetic of a payoff where most trades are small losses and a few are large wins, which is precisely what following a trend is.
The cash flow problem this creates
Here is where it stops being a statistics exercise and becomes an operating problem.
If you run this as a business and you draw income from it monthly, you have built a company whose revenue is negative in most months and whose entire annual result depends on a handful of weeks you cannot schedule. No other business would accept that structure without holding reserves against it, and most people running a trading account accept it without noticing they have accepted it.
Three specific failures follow, and all three are operational rather than analytical.
You stop the method during the flat stretch. Six consecutive months without a gain is the typical experience, not the disaster case. If your plan has no written statement of how long a losing stretch is tolerable before you conclude something is broken, you will decide it in month five, while it is happening, with your own money on the table. Deciding that in advance is most of what building a trading system is for.
You take the income out of the months that were supposed to fund the rest. If the good months are what pay for the 57 per cent that are not good, drawing them down as salary leaves nothing to carry the operation through the next flat stretch. That is the case for holding a cash reserve, and for paying yourself on a schedule that does not track the equity curve.
You set monthly targets. A monthly target applied to a payoff where most months are negative is an instruction to force trades in the months that were never going to produce any, which is exactly how the costs of the 335 worthless regimes get multiplied. Setting realistic monthly targets for this kind of business means setting them annually and measuring monthly, not the reverse.
What a business actually does about it
None of this is an argument against following trends. The 74.6 per cent of movement sitting inside 8.4 per cent of the regimes is real, and it is a genuine reason the approach has lasted. It is an argument about how the business around it has to be built.
Budget on the year, not the month. If the payoff concentrates into a few episodes a year, then a year is the shortest period over which the number means anything, and a month is a sample too small to interpret. The same sample size logic applies to judging the method at all, which is what a good expectancy ratio is really about.
Hold reserves sized to the flat stretch, not to the average. The average month is a number that almost never occurs. Size the reserve against 6 to 9 months of no gain, because that is the ordinary experience of a working method.
Write the definition down before you need it. My 200 day average is deliberately crude and I would not run it, but the fact that it is written down is why I can tell you it produced 417 regimes rather than a feeling. Identifying a trend is only useful once the definition is fixed, because an unfixed definition quietly moves to match whatever you are already holding.
And measure the concentration in your own record. If a small number of your trades are producing most of your result, that is not a flaw to correct, it is the shape of the business you are in, and it tells you that cutting winners short removes the only part that pays.
Get the free REX one page trading business plan, including a place to write down how long a flat stretch is allowed to run before you conclude anything at all. One email, no spam, unsubscribe anytime.
Get the free business plan →Frequently Asked Questions
Is trading following the trend strategy profitable?
This article does not answer that and cannot. What it shows is the shape of the payoff, which holds whether or not any given system has an edge. In the simulation I handed the system a positive edge on purpose, and it still spent the majority of its months at or below zero. Profitability depends on a real edge that you have to demonstrate on your own record. The shape is what you get either way.
Why use a 200 day average if you would not trade it?
Because it is simple enough that you can check my arithmetic, and because the concentration it reveals is a property of how gold moves rather than of the tool. A better definition changes the count of regimes. It does not turn a market where 8.4 per cent of episodes carry 74.6 per cent of the movement into a market where the movement is spread evenly.
Six months without a gain sounds like the system is broken. How do I tell?
You decide the answer before you start, and you write it down. In the simulation, a stretch of 6 was typical and 9 happened in one run out of ten, with a genuine edge present throughout. If your written tolerance is shorter than that, you will retire working methods on schedule. If you have no written tolerance, you will decide during the drawdown, which is the worst available moment.
Does the concentration mean I should only take the big trends?
There is no way to identify them in advance, which is the whole difficulty. The 35 long regimes only became identifiable as long regimes after they had run. You pay for the 335 short ones to remain positioned for the few that extend. Any filter that would have removed the short regimes would also have removed the early part of the long ones.
How does this change what I pay myself?
It argues for paying yourself a fixed amount set from the annual result and held in reserve, rather than a share of each month. A payoff where most months are negative cannot support drawing income from the months that happen to be positive, because those are the months funding the rest of the year.
Where did these numbers come from?
The regime statistics are my own arithmetic on the LBMA afternoon gold auction in US dollars, linked above, from 1 January 1975 to 24 September 2026, using a 200 day simple average and measuring movement as absolute logarithmic change summed within each regime. The month by month figures come from a simulation, not from history: 20,000 runs of 60 months at 4 trades a month, win rate 35 per cent, winners paying 3 planned risks and losers costing 1, random seed 20260925. That expectancy is an assumption I chose, not a measurement of any real system, and the figures describe the variance around it rather than any achievable return. No gold price level appears anywhere in this article.
About the author. Rex writes REX Trading Signal, where the account is treated as an operating business rather than a hobby with money in it. He is more interested in whether a business can survive its own revenue schedule than in whether a method is clever. Nothing in this article is a recommendation to trade, and no entry, stop or target discussed should be treated as a signal.