
Every trading community has the same argument running on a loop. Someone closes a trade, it keeps going, and the replies arrive: why did you not hold for the second target? Someone else moves a stop to break even, the market reverses, and the replies arrive again: why did you move it so early? Nobody ever wins this argument, and the reason is that both sides are reasoning from the one trade in front of them. Maximum favourable excursion is the number that ends it, because it turns an opinion about one trade into a distribution across all of them.
This is a measurement article, not a strategy article. There is no entry here, no stop, no target and nothing to copy. What follows is one column to add to your records, the arithmetic for reading it, and a simulation that shows what the column looks like when there is no skill involved at all, so you have something honest to compare yourself against.
What Maximum Favourable Excursion Actually Measures
Maximum favourable excursion, usually shortened to MFE, is the furthest a trade ever moved in your favour between the moment you opened it and the moment it closed. Its twin is maximum adverse excursion, MAE, which is the furthest it moved against you over the same window. Both are best recorded in R, where one R is the amount you planned to risk on that trade, not a currency figure. Recorded in R, trades of different sizes become comparable, and that is the whole point.
Your exit price tells you what happened. MFE tells you what was available. The gap between them is the only honest measure of whether your exits leave money behind, and it is a measure you cannot get from a profit and loss statement, because a profit and loss statement has no memory of the trade's best moment.
Here is why the distinction earns its keep. Two traders both close a trade at plus 0.4 R. The first had a trade whose MFE was 0.45 R, so there was nothing else on the table and the exit was close to optimal. The second had a trade whose MFE was 2.2 R, so the same result came from a very different situation. Identical outcomes, opposite lessons, and nothing in the account statement distinguishes them.
What the Base Rate Looks Like With No Edge At All
Before you judge your own numbers you need to know what chance produces, otherwise you will diagnose a problem that is simply the shape of randomness. So I simulated it.
The assumptions, all of them, because the conclusion is only worth what they are worth. Two hundred thousand simulated trades. Each trade takes up to 240 steps, and is abandoned if it is still open at the step limit. Each step moves the trade by an amount drawn from a normal distribution with a standard deviation of 0.08 R. Drift is exactly zero, meaning the simulated trade has no directional edge whatsoever. There is a hard stop at minus 1.0 R, and hitting it ends the trade. The random seed is 20261023, so these figures reproduce exactly if you rerun them.
On those assumptions, 39.9 per cent of trades hit the stop. Now the interesting part, which concerns only the trades that ended at a full minus 1 R loss. Of those losers, 46.2 per cent had been at least 0.25 R in profit at some point before they died. 20.9 per cent had been at least 0.5 R in profit. But only 2.7 per cent had ever reached a full 1.0 R, and only 0.2 per cent had reached 1.5 R. The median MFE of a losing trade was plus 0.22 R.
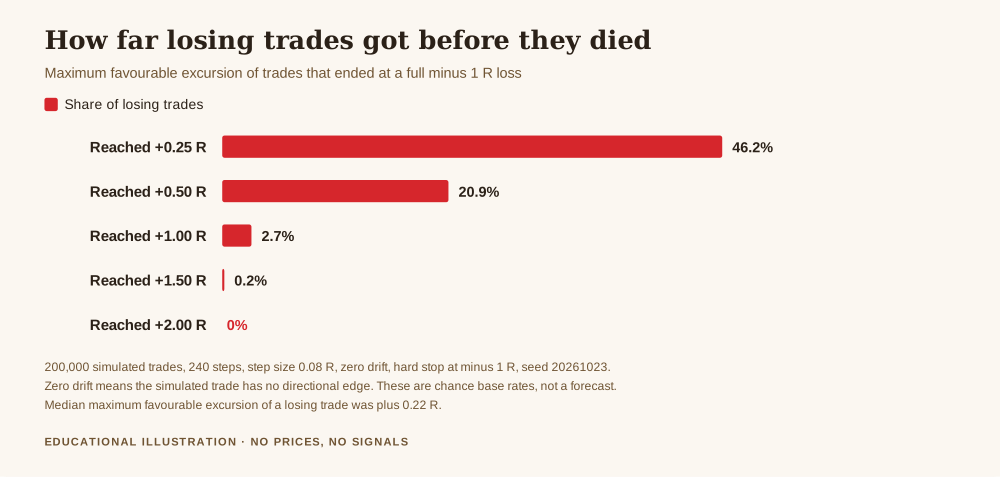
Read those two numbers together, because they settle something. Nearly half of all losing trades spend some time in profit, so the experience of watching a green trade turn red is not a symptom of anything. It is the base rate. But the trades that were up a full R and then lost everything are 2.7 per cent of losers, which is rare. So when you remember a run of trades that were deep in profit before they collapsed, the memory is almost certainly inflating the excursions. The small ones happened constantly, and memory promoted them.
That is a useful thing to know about yourself before you redesign your exit rules on the strength of a feeling.
Why Moving the Target Does Not Fix Anything On Its Own
The reflex response to leaving money on the table is to move the target further out. I ran that too, on the same 200,000 paths, with the same minus 1 R stop.
A target at plus 0.5 R was reached before the stop 62.8 per cent of the time. At plus 1.0 R, 38.5 per cent. At plus 1.5 R, 20.7 per cent. At plus 2.0 R, 9.8 per cent. At plus 3.0 R, 1.4 per cent. And the expectancy of every one of those rules came out within about 0.017 R of zero.
That last sentence is the finding. On a zero drift walk, moving the target trades win rate against payoff at almost exactly the rate that leaves you where you started. A near zero expectancy at every target is also the correct answer for a process with no edge, which is the sanity check that tells you the simulation is behaving.
So the argument that started this article cannot be settled in the abstract. Hold for the second target is not better advice than take the first one, and the reverse is not better either. Which is right depends entirely on the shape of your own MFE distribution, and that is a fact about your method and your market, not a fact about exits in general. Anyone who tells you the answer without having seen your numbers is telling you about their numbers.
The Bias This Is Actually Measuring
There is a reason this argument is permanent, and it was documented properly a long time ago. Terrance Odean tested the disposition effect, the tendency to hold losing investments too long and sell winning ones too soon, using the trading records from 1987 through 1993 for 10,000 accounts at a large discount brokerage house.
His measure was a pair of ratios. The proportion of gains realized, PGR, and the proportion of losses realized, PLR. Across the entire year, PGR was 0.148 against PLR of 0.098. Dividing one by the other gives a little over 1.5, which Odean puts plainly: a stock that is up in value is more than 50 per cent more likely to be sold from day to day than a stock that is down. He also notes that the pattern reverses in December, where PLR of 0.128 exceeds PGR of 0.108, which is tax motivated selling showing up in the data.
You can hear the same bias in the way people describe their own trades. In the REX inbox, roughly 12 messages cluster around moving a stop once a trade goes green, and that number is a keyword count across the inbox rather than a survey of anybody. One reader asked, "Do you think it is wrong to move my stop loss to breakeven after I hit TP1 or TP2?" Another described the outcome rather than the intention: "I moved my stop to breakeven, and eventually got stopped out at BE." A third put the motive plainly, "Once a trade does go my way I usually move my stop loss to prevent a losing trade."
Read that third one again, because it is the disposition effect stated in a single sentence by someone who was not trying to describe a bias. The goal has quietly changed from making money to not having a loser. Those are different objectives, they call for different exits, and MFE is what tells you which one you have actually been optimising for.
That is in a different market and a different instrument from the one most readers here trade, and it concerns investors rather than leveraged traders. The mechanism travels anyway, because it is a fact about people and not about stocks. You are structurally more likely to cut the thing that is working and sit with the thing that is not. MFE and MAE, recorded per trade, are the instruments that catch it happening in your own book, which is the only book you can do anything about.
How to Record It Without Buying Anything
Four columns, added to whatever you already keep. Planned risk in currency, which gives you your R. Realised result in R. MFE in R. MAE in R.
Getting the two excursion figures costs a minute per trade. Most platforms keep the high and the low of the period your position was open, and if yours does not, you read them off the chart when you close. Convert each into R by dividing the distance from your entry by the distance from your entry to your original stop. Original stop, not the one you moved, otherwise the denominator drifts and the whole series becomes incomparable.
One rule about this, and it is the rule that decides whether the exercise is worth anything: record it at the time, from the chart, not later from memory. The simulation above is the reason. Memory systematically inflates excursions, so a column filled in from recollection will tell you exactly the story you already believed, with the authority of a number attached. That is worse than having no column.
What the Numbers Tell You Once You Have Thirty of Them
Thirty trades is not a statistically comfortable sample and it is enough to see the obvious patterns. Four readings are worth looking for.
Your winners' median MFE sits well above your median winning exit. This is the exits are early diagnosis, and it is the only version of that complaint that counts as evidence rather than annoyance.
Your winners carry a large MAE. Your eventual winners spend a lot of time deeply against you. That points at entry timing or at a stop placed where normal noise reaches it, and it is worth separating those two before acting, because the fixes are opposite.
Your losers routinely show MFE above your usual target. If a meaningful share of the trades you lost had already travelled past where you normally take profit, then the target is reachable and something other than the target is stopping you from taking it. Usually that something is discretion applied in the moment.
Everything looks like the simulation. If your MFE distribution is indistinguishable from the zero drift base rates above, that is information too, and it is not information about your exits. It says the edge is not there yet, and no exit rule rescues a process without one. That is the least welcome reading and the most valuable.
Then change one rule, and only one. Re-measure over the next thirty. Changing two rules at once means you will not know which one did anything, which converts a measurement system back into an argument.
Putting It on the Books
The business framing matters here more than it usually does. No functioning business changes a process because someone felt bad about one order. It instruments the process, gathers enough observations to see a pattern, changes one variable, and measures again. Trading is unusual only in that the feedback is loud and immediate, which makes the discipline harder rather than less necessary.
MFE belongs in the same drawer as your cost figures and your monthly review. It is not exciting, it produces no trades, and it will not make a single afternoon better. What it does is end an argument you would otherwise keep having for years, with yourself and with everyone else, on no evidence at all.
What This Does Not Tell You
The simulation assumes zero drift and normally distributed steps. Real markets have structure, trends, fat tails and sessions, so the base rates above are a reference point for a process with no edge, not a prediction of what your trades will do.
MFE is not a target. The highest point a trade reached is visible only afterwards, and building a rule that aims to capture it is hindsight wearing a method's clothes. The number exists to tell you about a distribution, not to be hit.
And a high MFE on a trade is not a missed profit in any meaningful accounting sense. It was never yours. It was a price that printed while you held a position, which is a different thing from money you had and gave back, however similar the two feel at the time.
Get the free REX one page trading business plan, the document where the columns you measure and the rules you review get written down once, instead of being renegotiated on every loud afternoon. One email, no spam, unsubscribe anytime.
Get the free business plan →Frequently Asked Questions
What is maximum favourable excursion in trading?
It is the furthest a trade moved in your favour between opening and closing, best recorded in R, where one R is the risk you planned on that trade. Its twin, maximum adverse excursion, is the furthest it moved against you. Together they tell you what was available on a trade, which your exit price alone cannot.
How do I calculate it?
Take the best price the trade reached while you held it, measure the distance from your entry, and divide by the distance from your entry to your original stop. Use the original stop every time, not a stop you later moved, otherwise the denominator changes and the series stops being comparable.
Does a high MFE mean I exited too early?
Not on its own. One trade with a high MFE tells you nothing, because nearly half of losing trades also spend time in profit. The signal is in the distribution: if the median MFE of your winners sits well above your median winning exit across thirty or more trades, that is evidence. A single memorable trade is not.
Should I just use a wider target then?
Not without looking at your own numbers first. On the 200,000 zero drift simulations here, targets at 0.5, 1.0, 1.5, 2.0 and 3.0 R were reached 62.8, 38.5, 20.7, 9.8 and 1.4 per cent of the time, and the expectancy of every one of those rules landed within about 0.017 R of zero. Widening the target trades win rate for payoff. Whether that trade is good depends on your distribution, not on the general principle.
Why record MAE as well?
Because it answers a different question. A large MAE on the trades that eventually won tells you your winners are surviving deep moves against you, which points at entry timing or at a stop sitting inside normal noise. Those two causes need different fixes, so it is worth separating them before changing anything.
Is this the same as the disposition effect?
They are related. The disposition effect is the documented tendency to sell winners too soon and hold losers too long. Odean measured it across 10,000 brokerage accounts and found a proportion of gains realized of 0.148 against a proportion of losses realized of 0.098, a ratio of a little over 1.5. MFE and MAE are the instruments that let you check whether the same bias is operating in your own records.
Where did the numbers in this article come from?
The 0.148, 0.098 and the ratio above 1.5, the 10,000 accounts and the 1987 to 1993 period, are from Odean's paper, linked below and verified through Crossref. Everything else, the 39.9 per cent stop rate, the 46.2, 20.9 and 2.7 per cent excursion figures, the median MFE of 0.22 R and the whole target table, is computed from the simulation whose assumptions are written out above, with a fixed seed so you can reproduce or refute it.
Where REX Trading Signal Fits
REX Trading Signal is free to follow. The daily record goes up on Telegram with the reasoning written before the trade rather than explained after it, losing days included. There is a free one page business plan for anyone who wants the operating documents in one place, and an optional Kit. Nothing here promises a profit.
A measurement column belongs in the document where your operating rules live, which is the one page trading business plan. How to keep a trading journal like a professional is where these four columns actually go, how to take profit like a business is the exit policy this number is used to judge, key metrics every trading business should track puts it beside the rest of the instrument panel, and managing an open trade like a business covers the decisions being measured. The external source here is Terrance Odean, Are Investors Reluctant to Realize Their Losses?, Journal of Finance 53(5), 1998, pages 1775 to 1798, DOI 10.1111/0022-1082.00072, with background on contract mechanics from the CFTC's futures market basics.
About the author. Rex writes REX Trading Signal. He runs the account as a business, which mostly means measuring a process before rewriting it, and resisting the urge to redesign the exits after one loud afternoon. Nothing in this article is a recommendation to trade, and no entry, stop or target discussed should be treated as a signal.
Disclaimer: This article is general educational content about trade record keeping and performance measurement. It is not financial advice, not investment advice and not a recommendation to buy, sell or use any product, venue, broker or firm. Simulated results are simulated, they assume no directional edge, and they are not a forecast of any real instrument. Trading carries risk of loss. Only commit capital you can afford to lose.