
Somebody sends you a robot, or sells you one, and the question that decides the next six months of your account is whether the thing works. So you open the terminal and ask how to test expert advisor mt4, expecting the answer to be a sequence of clicks. The clicks are the easy part and they take about four minutes. The part that matters is what the number at the end of those four minutes actually entitles you to believe, and on MT4 specifically there are three places where the tester will hand you a confident figure built on an assumption you did not make.
This is a purchasing decision for your business. You are deciding whether to hand a capital allocation to an automated process that will operate without supervision. No other purchase in a trading business gets approved on the strength of a graph that slopes upward, and this one should not either.
How to test expert advisor mt4, the sequence that matters
MetaQuotes documents the tester in the platform's own help, and the Strategy Testing section states its purpose plainly: the terminal lets you test expert advisors on history data before using them, and the same window can optimise the expert's inputs. Open it with the Strategy Tester panel, choose the expert, the symbol and the period, set the date range, set the modelling method, and press Start.
The order that matters is not the order of the fields. It is this. Decide what result would make you reject the robot, and write it down, before you press Start. Then run the test. A number you can interpret after the fact is not evidence, because there is no outcome that would have changed your mind. Write the rejection rule first and the test becomes an experiment instead of a search for permission.
Everything below is about the three ways MT4 will quietly undermine that experiment.
Trap one, the modelling method decides the result
MT4 offers three ways of generating prices inside a bar, and the setup page describes each one.
Open prices only is the fastest and is intended for systems that act on completed bars, where the bar is completed once the next one appears. Control points uses the nearest lesser timeframe, and MetaQuotes is candid about its standing: it is "intended for a crude estimate", the historical data of the nearest lesser timeframe must be available, and in most cases results from control points "can also be considered as estimated ones, not as final ones". Every tick uses not just the nearest lesser timeframe but all available nearest timeframes, and the documentation calls it the most accurate method of modelling prices within a bar.
The documented guidance follows from that: control points is for optimisation runs, and all ticks modelling is for a close test. If your robot touches the price inside a bar at all, through a trailing stop, an intrabar stop loss, a pending order, or any indicator read on the current candle, the first two methods are not approximations of reality. They are a different market.
There is a detail here that catches people hardest. The help page for the report window says that if the fastest method, Open prices only, was selected, the entire modelling band will be red and "n/a" will be written in the Modelling quality field. The tester does not refuse to produce a result. It produces a full report, with a profit figure and an equity curve, and quietly declines to rate the data it was built on.
Trap two, the Modelling quality figure and the colour band
The report prints three fields that people skip on the way to the profit line: Bars in test, Ticks modelled, and Modelling quality, which is the quality of the ticks modelled expressed as a percentage. Underneath sits a coloured band showing the modelling across the test period.
The grey part of that band is the one to look at. Both the setup page and the results page explain that grey marks a section of available data that was not involved in the testing, which can happen when a date range was specified. A test that reports a result over a period you did not fully test is not lying to you, it is telling you in a colour that most people never read.
So before the profit figure means anything, three readings have to be taken from the report: is Modelling quality a number rather than n/a, how high is it, and is the band free of grey. If the answer to the first is n/a, you have measured a system under the assumption that price never moved inside a bar.
Trap three, the spread is frozen at the moment you pressed Start
This is the one I would put in front of anybody buying a robot for gold, and it is stated directly on the setup page: "The price history stored in the client terminal includes only Bid prices. On default, to model Ask prices, the strategy tester uses the current spread of a symbol at the beginning of testing."
Read what that means operationally. MT4 does not store the spread that existed at each historical moment. It takes one spread, the one quoted when you started the test, and applies it across the entire history. Start a two year backtest of a gold robot at three in the afternoon in a calm session and the whole two years is priced at a calm afternoon spread. The field is editable, so a custom spread can be set, but the default is a snapshot of one instant.
Put numbers on it. Assume a gold quote with two decimals, so one point is one cent, and a one lot position of 100 ounces, which makes one point worth one dollar per lot. Suppose the test inherited an 18 point spread and the robot actually trades an average of 32 points. That is 14 points of unmodelled cost on every round trip. At a tenth of a lot that is 1 dollar 40 per trade. Over 480 round trips, a modest year for an intraday robot, it is 672 dollars, or 6,720 points of cost that the backtest never charged.
What the losing streak proves, which is usually nothing
A robot goes live, loses nine trades in a row, and gets switched off. The reasoning feels sound: nine losses is not what the backtest showed. But a losing run of that length is an ordinary event, not a broken system, and the arithmetic is not difficult.
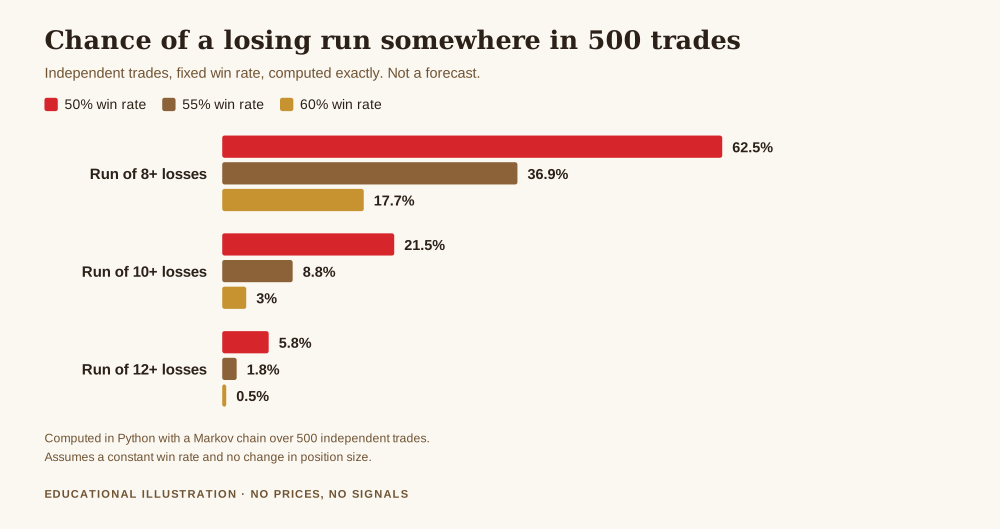
Treating trades as independent with a fixed win rate, the probability of hitting a run of eight or more losses somewhere in 500 trades is 62.5 per cent at a 50 per cent win rate, 36.9 per cent at 55 per cent, and 17.7 per cent at 60 per cent. A run of ten or more sits at 21.5, 8.8 and 3.0 per cent respectively. I computed these with a Markov chain over the 500 trades, assuming a constant win rate and no change in position size.
So a system with a genuine 55 per cent edge has better than a one in three chance of producing an eight trade losing run inside a normal year. If your shutdown rule is "eight losses in a row", you will switch off a working system more often than not. The number that should trigger a review is one you set in advance from the system's own statistics, which is the same discipline as setting a daily loss limit before the day that needs it.
The optimisation tab is where backtests go to die
The tester will optimise inputs for you, and this is the single most dangerous button in the platform, because it is the one that always finds something.
Take four inputs with ten candidate values each. That is 10,000 passes. If every one of those parameter sets were worthless, and each had an independent 5 per cent chance of clearing a significance bar by luck alone, you would expect 500 of them to clear it anyway, and the probability that at least one does is indistinguishable from certainty. Push it to five inputs with eight values each and the grid is 32,768 passes with about 1,638 lucky winners waiting to be discovered.
The optimiser does not report that. It reports the best pass. And the best of 10,000 random results looks exactly like a discovery, with a smooth upward curve and a flattering profit factor, because selecting the maximum of a large sample is what manufactures those shapes. This is the same failure as overfitting, arriving through a button rather than a spreadsheet, and the defence has not changed: the parameters have to be chosen on one period and judged on another that played no part in choosing them.
If you only take one rule from this section, take this one. Count the passes before you run the optimisation, and write the number down next to the result. A result drawn from 10,000 attempts and a result drawn from 3 are not the same kind of evidence, and the report prints them identically.
What people actually tell me about buying an edge
The reason I push this hard on testing is that the alternative shows up in my inbox constantly. Roughly 79 messages there mention signal services and whether they are worth paying for, and that is a count of keyword matches in my own messages rather than a survey, so treat it as a description of my inbox and nothing more. The pattern inside them is consistent.
One reader wrote: "I have paid a lot to enter different signal groups but I have wasted over 3000 dollars in the course of five months trying to get things right." Another: "I have been copying some of my trades from a public channel for a while now, but my portfolio isn't doing well at all." A third put the whole problem in one line: "I want to trade if there is a reliable signal channel. I will also start learning."
A robot is the same purchase wearing different clothes. In all of these cases money went out before any test was run, and the test that was eventually run was the live account. That is the most expensive testing environment available, and the only one where a failed experiment costs you capital rather than an afternoon.
The strategy tester is free, it is already installed, and it will give you a defensible answer in an hour. The only reason to skip it is that you are afraid of what it will say, which is itself the answer.
Get the free REX one page business plan, the document where an acceptance test and a shutdown rule live so they survive the week you need them. One email, no spam, unsubscribe anytime.
Get the free business plan →Putting it on the books
Treat the robot as a supplier and the test as due diligence, and the paperwork writes itself. Four lines go in the operating document before any money moves.
First, the acceptance test: the modelling method you will accept, the minimum Modelling quality figure, a band with no grey in it, and the spread you set manually rather than inherited. Second, the out of sample period: dates chosen before the optimisation, never looked at while selecting parameters. Third, the pass count: how many optimisation runs produced the chosen parameter set, recorded next to the result, because that single number is most of what the result is worth. Fourth, the shutdown rule: the drawdown or losing run that triggers a review, set from the system's own numbers rather than from how it feels on the day.
Those four lines belong in the one page trading business plan, not in your memory. The whole point of writing a rule down is that the moment you need it is the moment you will least want to follow it.
What this article does not say
It does not say that MT4 is unsuitable for testing or that automated systems do not work. It says the tester reports exactly what it was asked to report, and the defaults embed assumptions most users never choose: a spread frozen at the instant you pressed Start, a modelling method that may be rated n/a, and an optimiser that will always find a winner because that is what searching a large grid does.
The streak probabilities assume independent trades at a constant win rate, which no real system quite satisfies: results cluster, volatility regimes persist, and a robot's win rate drifts. They are there to calibrate your expectations about ordinary bad runs, not to forecast any particular system. The spread example uses figures I chose to be illustrative and stated in full, and your own broker's average spread is the one that matters.
Nothing here is a view on any specific expert advisor, and a good backtest remains a necessary condition rather than a sufficient one. Passing the test is what earns a robot a small live allocation and a review date, not a full one.
Frequently Asked Questions
How to test expert advisor mt4 properly, in short?
Write the rejection rule before you start, run Every tick rather than Open prices only, set the spread manually instead of accepting the one captured at launch, check that Modelling quality is a number and not n/a, check the colour band for grey, and record how many optimisation passes produced the parameters you chose.
What does Modelling quality mean on the MT4 report?
MetaQuotes describes it as the quality of the ticks modelled during testing, expressed as a percentage, shown with a coloured band underneath. Grey in that band marks available data that was not involved in the testing. If Open prices only was selected, the band is entirely red and the field reads n/a.
Why does my backtest look better than my live results?
The spread is the first place to look. MT4 stores only Bid prices and by default models the Ask using the current spread of the symbol at the beginning of testing, so an entire multi year test can be priced at one quiet moment's spread. On the illustrative figures above, 14 points of unmodelled spread across 480 round trips at a tenth of a lot is 672 dollars the test never charged.
Is nine losses in a row a sign the robot is broken?
Usually not. On independent trades at a 55 per cent win rate, the chance of a run of eight or more losses somewhere in 500 trades is 36.9 per cent. Set the shutdown trigger from the system's own statistics in advance, and the live streak becomes information instead of panic.
What is wrong with using the optimiser?
Nothing, provided you count the passes. Four inputs with ten values each is 10,000 passes, and if each worthless set had an independent 5 per cent chance of looking good, roughly 500 would look good by luck alone. The optimiser reports the winner, not the sample size that produced it.
Where did the numbers in this article come from?
The modelling methods, the Modelling quality field, the n/a behaviour, the grey band and the frozen spread are from MetaQuotes' own MetaTrader 4 help pages, linked above and checked live before publication. The streak probabilities, the 10,000 and 32,768 pass counts, the 500 and 1,638 expected false positives and the 672 dollar spread figure are my own arithmetic under the assumptions stated where each appears.
Where REX Trading Signal Fits
REX Trading Signal is free to follow. The daily record goes up on Telegram with the reasoning written before the trade rather than explained after it, losing days included. There is a free one page business plan, and an optional Kit for people who want the full operating system. Nothing here promises a profit, and nothing here is a signal service you should follow blindly. If you want the neighbouring piece, testing an EA on MT5 covers the newer tester, whose real tick mode removes the first of the three traps above.
About the author. Rex writes REX Trading Signal. He runs the account as a business, which mostly means that a supplier gets a trial and a review date rather than a leap of faith. Nothing in this article is a recommendation to trade, and no entry, stop or target discussed should be treated as a signal.