
Ask most people to describe their trading business model and you get a strategy instead. Entry conditions, an indicator or two, maybe a timeframe. That is not a business model. That is a production method, and a business that knows how it makes the product but not what the product costs or how much of it can be made is not a business yet.
A model answers four questions, and they are the same four whether you are running a bakery or an account. What do you sell. What does one unit cost to produce. What margin does a unit carry. How many units can you make. Below I work through all four for a trading account, with the arithmetic shown. Standing rule here: no entry, stop or target discussed should be treated as a signal.
What You Actually Sell
Start here, because almost everyone gets it wrong, and the error runs downhill into everything else.
You do not sell predictions. Nobody pays you for being right. What you sell, in the economic sense, is willingness to carry risk that other people want to hand off, and what you are paid is the expected value of carrying it. That payment is uncertain, it arrives in an unhelpfully lumpy fashion, and it is entirely possible for it to be negative without anybody telling you.
Framing it this way fixes a common confusion immediately. A losing trade is not a failure of the product. It is a unit sold at a loss, which happens in every business that carries inventory risk, and the relevant question is never whether a single unit lost money. It is whether the average unit carries a positive margin. That is a different question, it needs a different sort of evidence, and it takes far more units to answer than most people allow.
The Unit Economics of a Trading Business Model
Every business has a unit and a margin per unit. Yours is one trade, and the margin is expectancy.
To keep this comparable across account sizes I will express everything in R, where 1R is the amount you have decided to lose if a trade goes against you. Every trade risks exactly 1R. A winner is worth some multiple of R. Expectancy per trade is then your win rate times your reward, minus your loss rate times 1R.
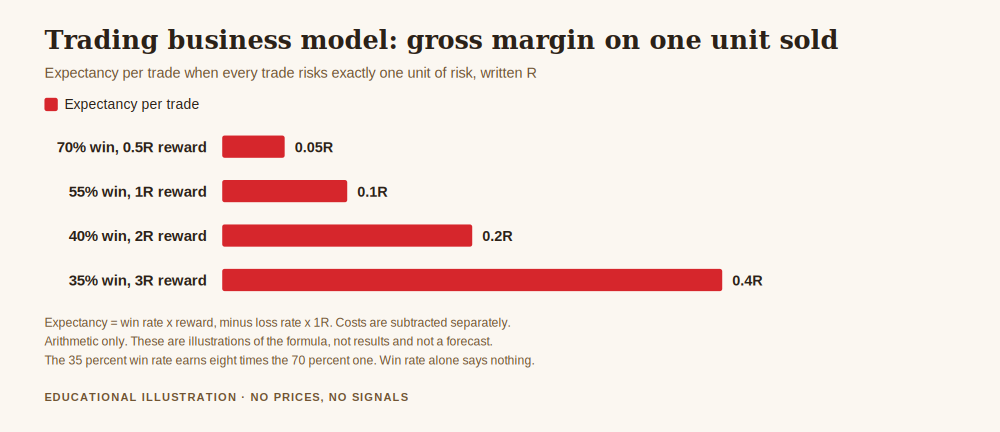
Read that chart slowly, because it contains the most expensive misunderstanding in this industry. The operation winning 70 percent of the time returns 0.05R per trade. The operation winning 35 percent of the time returns 0.40R per trade. The one that is wrong roughly two times in three earns eight times as much per unit as the one that is right seven times in ten.
Win rate on its own tells you nothing about the business. It is one of two inputs, and quoting it alone is like a shop announcing how many customers it served without mentioning what they paid. Anyone who tells you their win rate and not their reward has described half of a number, and it is not the important half.
These are arbitrary illustrations of a formula, not results and not targets. The point is the shape of the relationship, not the specific figures.
What One Unit Costs to Produce
Now the part that gets left out of every strategy discussion, and it is the part that decides the outcome for most accounts.
Producing a unit costs money before it earns anything. The spread is charged on entry. There may be a commission. Hold overnight and there is a financing charge. None of these care whether the trade was any good. They are the cost of goods sold, and they are charged on every unit, winners and losers alike.
Suppose your gross edge is a modest +0.20R per trade, and your round turn cost is 0.05R. Your net is 0.15R, which means costs have consumed 25 percent of your margin. Let the cost rise to 0.10R, which is entirely achievable by trading a wider instrument at a worse time of day, and it takes half of everything the edge produced.
Then multiply by volume, because this is where it turns from an annoyance into the whole story. At 0.05R per round turn:
- 50 trades a year costs you 2.5R in fees alone
- 250 trades a year costs 12.5R
- 1,000 trades a year costs 50R
The same cost per unit, the same edge, three completely different businesses. The high frequency version has to be right far more often merely to stand still, which is why frequency is a strategic decision about your cost base rather than a matter of style or personality. The detail of which costs are fixed and which scale with activity is worked through in the fixed and variable costs of a trading business.
Capacity, the Constraint Nobody Writes Down
Every real business has a ceiling on output. A restaurant has tables. A workshop has hours. Your account has the number of situations that genuinely meet your criteria, and that number is set by the market rather than by your ambition.
This is the constraint that gets ignored, and ignoring it produces the single most common operating failure in trading: manufacturing units to fill capacity that was never there. The month is quiet, the criteria are not being met, and rather than accept a low output month you loosen the criteria until the output looks respectable. You have not increased production. You have started producing a different, worse product while telling yourself the volume is the same.
A business that does this is recognisable from the outside. It is the one discounting to hit a monthly number. It works for exactly as long as it takes for the margin to go negative, and then it works very badly indeed.
Write your capacity down as a range before the month starts. Some months your market gives you four qualifying situations and some months it gives you fifteen, and both are normal. A month with four is not a bad month. A month where you took eleven and only four qualified is a bad month, and the difference is invisible unless capacity was written down in advance. That is the sort of thing the metrics every trading business should track exists to catch.
The Base Rate You Are Trading Against
Any honest business plan states the industry base rate, and this industry publishes one, because regulators made it.
When the European Securities and Markets Authority reviewed retail contracts for difference across member states, national regulators' analyses found that 74 to 89 percent of retail accounts typically lose money, with average losses per client ranging from 1,600 to 29,000 euros. That figure is why your broker is required to display a loss percentage on its own advertising.
Sit with that as a business fact rather than as a warning label. If you opened any other kind of business and the published failure rate for new entrants was around eight in ten, you would not be paralysed by it, but you would want to know exactly what the eight did. The answer is not mysterious and it is in this article: they never established their cost per unit, never measured margin per unit over a sample large enough to mean anything, and had no written capacity, so they filled the gap with volume.
The base rate is not a prophecy about you. It is a description of what happens to operations run without a model, and that is a solvable problem.
Writing Yours Down
Your whole model fits on one page, and until it is on that page it is not a model, it is a set of intentions.
- Product. Which instrument, which conditions, stated so precisely that another person could tell whether today qualified.
- Unit. One trade, risking 1R, with R defined in money and as a percentage of the account.
- Gross margin. Your expected R per trade, and how many trades of evidence sit behind that figure.
- Cost of goods. Spread plus commission plus financing per round turn, expressed in R, measured from your own statements rather than from the broker's marketing.
- Capacity. Qualifying situations per month, as a range, written before the month starts.
- Solvency limit. The drawdown at which you stop and review rather than continue and hope.
Six lines. Most people running an account cannot fill in four of them, which is the real finding underneath the regulator's number.
Get the free REX one page business plan, the sheet where your unit, your cost per round turn, your capacity and your drawdown policy live together on a single page. One email, no spam, unsubscribe anytime.
Get the free business plan →Frequently Asked Questions
What is a trading business model in one sentence?
It is the written statement of what you sell, what one trade costs to produce, what margin the average trade carries, and how many trades a month your market actually offers. A strategy tells you when to enter. A model tells you whether entering is a business.
Is a high win rate not better than a low one?
Only if the reward is held constant, and it never is. The arithmetic above shows a 35 percent win rate paying 3R returning eight times more per trade than a 70 percent win rate paying 0.5R. Win rate is one of two inputs, and on its own it is closer to a marketing number than an operating one.
How do I find my real cost per round turn?
From your own statements, not from the broker's advertised spread. Take a month of closed trades, total everything charged that was not the price movement itself, and divide by the number of trades. Then express it as a fraction of your R. Most people are surprised, and the surprise is nearly always in the same direction.
Does this mean trading less is always better?
Not always, but it does mean frequency has to earn its place. Each additional trade adds a fixed cost and only adds value if it carries the same expected margin as the others. Trades taken to fill a quiet month rarely do, which is why volume tends to fall hardest on the accounts that can least afford it.
How many trades before my margin figure means anything?
More than you would like. A few dozen trades tell you almost nothing about a thin edge, because the variation in outcomes swamps the signal at that size. Treat any expectancy figure built on a small sample as provisional and size as though it might be wrong, because it might be.
Does the 74 to 89 percent figure apply to me?
It describes retail accounts across a set of European jurisdictions in the period the regulators studied, so it is a base rate rather than a personal probability. Its use here is as a reference point for how many operations run without the six lines above, not as a prediction about any individual.
Where This Leaves You
The gap between people who last in this business and people who do not is rarely the strategy. It is that one of them can tell you their cost per unit, their margin per unit, and their monthly capacity, and the other has a set of entry rules and a feeling about how it is going.
None of the six lines requires a better indicator or more screen time. They require an afternoon with your own statements and the willingness to write down numbers that may be less flattering than the ones in your head. That is the least glamorous work available to you and it is the work that separates an operation from a hobby.
Write the page. Then run the business against it, and let the page rather than the last trade tell you how it is going.
The one page trading business plan template is where these six lines live alongside the rest of the operation, and it is free.
REX Trading Signal is a free Telegram channel with daily XAUUSD analysis, the reasoning stated before the trade, losing days included. There is nothing to buy to follow along, an optional Kit if you want more structure, and no profit claims, because there honestly cannot be any.
About the author. Rex writes the REX Trading Signal journal. He treats a trading account as a small business with a balance sheet, an operating tempo and a set of constraints, on the view that most accounts fail for ordinary business reasons rather than exotic market ones.
Disclaimer: This article is general educational content about business structure and unit economics applied to a trading account. It is not financial advice and it is not a recommendation to buy or sell anything. Trading gold, CFDs and leveraged products carries a high risk of losing money rapidly. No entry, stop or target discussed should be treated as a signal. The win rates, reward multiples, cost figures and trade counts used above are arbitrary illustrations chosen to demonstrate the arithmetic of expectancy and cost, not targets, forecasts or claims about results. The retail loss statistics are those published by the European Securities and Markets Authority, quoted as a base rate for the sector and linked so you can check them.