
A year end review for your trading business is the one piece of admin that almost everybody does badly, because it is the only review where the emotional stakes are high enough to bend the conclusion. The weekly review asks what went wrong on Tuesday. The annual one asks whether this thing works, whether you should still be doing it, and whether the last twelve months were skill or weather. Those are much bigger questions, and the honest answer to several of them is that one year cannot tell you.
That sounds like a reason to skip it. It is the opposite. Knowing precisely which questions a year can answer, and which it cannot, is what turns the review from an exercise in self congratulation or self flagellation into something an operator can actually use.
What a year end review for your trading business is actually for
Start by separating two things that get reviewed together and should not be.
The first is the business: your costs, your capital, your withdrawals, your platforms, your record keeping, your tax position, the hours you spent. These are all countable, they are all under your control, and a year is a perfectly good period over which to judge them. If you spent more on data subscriptions than you drew from the account, that is a fact and it needs no confidence interval.
The second is the method: whether your edge is real and how large it is. This is where a year is a much weaker instrument than people assume, and where most annual reviews quietly go wrong. Almost every painful decision I have watched an operator make in January came from applying the certainty appropriate to the first category to a question belonging in the second. The monthly profit and loss review has the same split in miniature, and the annual version simply makes the gap between the two more expensive.
The survival numbers you are actually being measured against
Before judging your own year, it helps to know the benchmark for new businesses generally, because traders tend to compare themselves against an imaginary standard where everybody else is compounding smoothly.
The US Bureau of Labor Statistics tracks this properly in its Business Employment Dynamics programme, which follows private sector establishments by the year they opened. Of establishments that opened in March 2024, 77.9 per cent were still operating one year later. Of those that opened in March 2020, 51.4 per cent were still going after five years. Of those that opened in March 2010, 35.3 per cent made it to ten years.
So roughly one new business in five does not see its second birthday, about half are gone by year five, and about two thirds are gone by year ten. That is the ordinary shape of business formation across every industry the BLS counts, including ones with premises, staff and customers. Reading your own first or second year against that is a more useful comparison than reading it against somebody's screenshot.
A narrower benchmark exists for this industry in particular. When ESMA reviewed retail contracts for difference across the European Union, it reported that between 74 and 89 per cent of retail accounts lost money, with average losses per client ranging from roughly 1,600 to 29,000 euros. That measures accounts rather than businesses, and over a different period, so it is not a like for like comparison with the BLS figures. It is the closest published number to the activity you are reviewing, and it is the reason the survival bar for this particular business is worth treating as lower rather than higher than the economy wide one.
It cuts both ways, which is why I like it. Surviving a year is genuinely an achievement and worth recording as one. It is also not evidence that the thing works, because 77.9 per cent of all new establishments managed the same.
What one year of trades can actually prove
Here is the part that changes how the review should be written.
Suppose your method is a coin flip. No edge at all, wins and losses the same size, and to keep it clean, no costs. How wide is the range of results that a year could produce anyway?
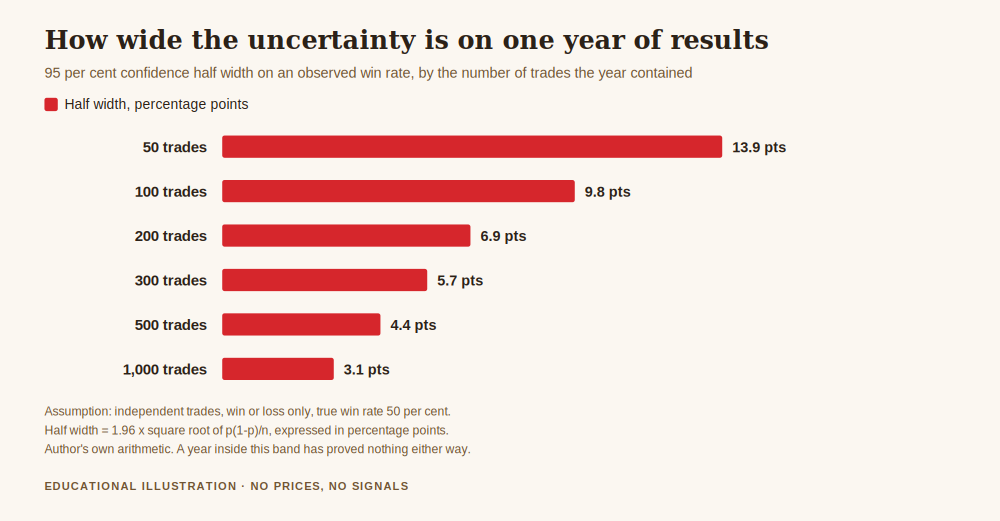
At 100 trades in the year, the 95 per cent confidence band around an observed win rate is plus or minus 9.8 percentage points. At 200 trades it is 6.9 points, at 300 it is 5.7, at 500 it is 4.4, and you need 385 trades before the band narrows to plus or minus 5 points. Most part time operations do not place 385 trades in a year.
Which means that if you traded 200 times last year and finished with a 55 per cent win rate, that result is entirely consistent with a true rate of 50 per cent. It is also consistent with a true rate of 60. The year did not distinguish between those, and no amount of reviewing the journal will make it do so.
The same arithmetic applied to the bottom line: a trader with no edge whatsoever, placing 100 trades of equal size, finishes the year in profit 46.0 per cent of the time. At 200 trades, 47.2 per cent. Close to half of all no edge operators finish any given year up. A profitable year is therefore very weak evidence of an edge, which is an uncomfortable thing to write down in a review and the single most valuable line in it.
Why "better than last year" is usually not a finding
The comparison every annual review reaches for is this year against last year, and it is weaker still, because now you are subtracting two noisy numbers from each other.
For two years of equal size with the same underlying rate, the noise on the difference is larger than the noise on either year alone by a factor of about 1.4. At 200 trades a year, a year on year swing in win rate of anything under 9.8 percentage points cannot be distinguished from chance. At 300 trades a year the threshold is 8.0 points. At 500 it is 6.2.
Read that against how these conversations normally go. Somebody's win rate moved from 48 to 54 per cent, they attribute it to a change they made in March, and they build next year's plan around it. On 200 trades a year that is a 6 point move inside a 9.8 point noise band. The change in March may have helped. The year simply did not measure it.
This is not an argument for ignoring your results. It is an argument for writing the uncertainty next to the number, every time, so that next year's plan is not built on a foundation that was never there. The metrics worth tracking, and the sample each one needs before it says anything, are covered in key metrics every trading business should track.
The drawdown that belongs inside an ordinary year
One more figure, because it decides whether a bad stretch means anything.
I simulated 20,000 years of 200 trades for an operator with no edge at all, wins and losses of one planned risk each, fixed random seed. The median deepest peak to trough decline inside those years was 15.0 planned risks. The ninetieth percentile was 27.0. The ninety ninth was 38.0.
So a 15R drawdown is the typical experience of a year that ends exactly where it started. If your review records a drawdown of that order and treats it as the year's defining disaster, the review has misread ordinary variance as a verdict. And if your business plan assumed a worst case of 10R, the plan was not conservative, it was simply below the median of a coin flip.
That number belongs in the plan rather than in the post mortem, which is what the one page trading business plan is for: deciding in advance how deep a decline has to be, and how long a flat stretch has to run, before either of them actually means something.
The review that is worth doing
Given all that, here is the agenda I would actually work through, in this order, because the order is what keeps the conclusions honest.
Count the business first. Total costs for the year, broken into fixed and variable. Total withdrawn and total added. Hours spent, honestly, including the ones spent watching. Any platform, data or financing cost that has grown without anybody deciding it should. These are facts, they need no statistics, and they are where most improvement is available.
Then count the activity. Number of trades, so you know which row of that chart you are on, and therefore how much weight anything else in the review can carry. Do this before looking at the results, because knowing the sample size first stops you over reading what follows.
Then the results, with the band attached. Not "win rate 55 per cent" but "win rate 55 per cent on 180 trades, which cannot be distinguished from anything between roughly 48 and 62". Write the range. It is the difference between a measurement and a story.
Then the process questions, which a year genuinely can answer because they are not statistical. Did you follow your own rules, and where specifically did you not. Did the record keeping hold up. Did you take the trades you had planned to take, and skip the ones you had planned to skip. A year is an excellent instrument for measuring adherence, and adherence is the thing you can actually change. The weekly habit that feeds this is in how to run a weekly review for your trading business, and without those records the annual version has nothing to read.
Then, and only then, the decision. Continue, adjust, scale down, or stop. Made against the costs, the adherence and the capital, which the year measured well, rather than against the win rate, which it probably did not.
What this does and does not change
It does not say results are meaningless or that you should stop measuring. It says the opposite: measure, and attach the uncertainty, because a number without its band invites a conclusion it cannot support.
It does not say a losing year should be dismissed as variance. A year of losses may be variance, and it may be a method that does not work, and the honest position is usually that you cannot yet tell from the trading record alone. That is exactly why the costs, the adherence and the capital matter so much in the decision: those you can read clearly.
It does not promise that more trades would settle the question. More trades narrow the band on the win rate and they also cost more in fees and attention, and an operator placing trades to build a sample is no longer running the method being measured.
What it changes is the tone of the document. A good year end review for your trading business reads like a set of accounts with error bars, not like a verdict. It tells you what you spent, what you followed, what you can conclude, and what you will need several more years to know. That is a less satisfying document than the one most people write in January, and it is the only kind that does not mislead the person who has to act on it.
Get the free REX one page trading business plan, including a place to write down how deep a decline and how long a flat stretch are allowed to run before either of them means anything. One email, no spam, unsubscribe anytime.
Get the free business plan →Frequently asked questions
When should I run a year end review for your trading business, calendar year or tax year?
Use whichever your records already run on, and then keep it. The value is in comparing like with like across years, and re-cutting the period is the easiest way to accidentally choose a flattering window. If your tax year already forces you to assemble costs at a particular date, run it there and save yourself doing the work twice.
My year was profitable. Does that not prove the method works?
It is evidence, but much weaker evidence than it feels. An operator with no edge at all finishes a 200 trade year in profit 47.2 per cent of the time. A profitable year is consistent with a real edge and equally consistent with a coin flip, so it should raise your confidence a little and settle nothing.
How many years before I can actually tell?
It depends on trades rather than years. The band narrows to plus or minus 5 percentage points at 385 trades, so an operator placing 100 trades a year is looking at something close to four years before the win rate alone is that well measured, and longer if the true edge is small. This is why adherence and cost control carry so much of the decision in the early years: they are measurable now.
What if I had a large drawdown last year?
Compare it to what ordinary variance produces before concluding anything. In the simulation above, a no edge year of 200 trades produced a median deepest decline of 15 planned risks, and 27 at the ninetieth percentile. A decline inside that range is not by itself evidence of a broken method, though it may be evidence that the position sizing was built for a gentler year than the one that arrived.
Should the review change what I pay myself?
The review is the right place to set that figure for the following year, from the annual result and the cash reserve rather than from any single good month. What it should not do is treat one strong year as a new baseline to draw against, given how wide the band on a single year is.
Where did these numbers come from?
The survival rates are from the US Bureau of Labor Statistics Business Employment Dynamics series, table 7, survival of private sector establishments by opening year. The confidence bands, the profitable year probabilities and the year on year threshold are my own arithmetic, assuming independent trades with a win or loss outcome and a true win rate of 50 per cent, using the normal approximation at 1.96 standard errors and, for the profitable year figures, the exact binomial. The drawdown figures come from a simulation rather than from history: 20,000 runs of 200 trades, wins and losses of one planned risk each, fair coin, random seed 20260926. Those assumptions describe variance around no edge and are not a claim about any real system's returns. No gold price level appears anywhere in this article.
About the author. Rex writes REX Trading Signal, where the account is treated as an operating business rather than a hobby with money in it. He would rather hand an operator a conclusion with an error bar on it than a clean number that turns out to have been weather. Nothing in this article is a recommendation to trade, and no entry, stop or target discussed should be treated as a signal.