
Every trader eventually writes a trading rules checklist. It usually happens on a Sunday, after a week that went badly, and it usually contains between eight and twenty items written in the voice of a person who has just been hurt. Then it goes into a drawer, digital or otherwise, and the account carries on exactly as before.
The failure is not one of willpower. It is one of business design. A rule with no cost attached to breaking it is not a rule, it is a wish, and a business that runs on wishes has no controls at all. This article is about the numbers underneath each rule, because a rule you can price is a rule you will keep. As always here, no entry, stop or target discussed should be treated as a signal.
Why Most Rule Lists Fail
Three reasons, and none of them is that you lack discipline.
The list is written as aspiration. Items like be patient and do not overtrade cannot be complied with or breached, because there is no observable event that settles the question. A control needs a trigger, a threshold and an outcome. Be patient has none of the three.
The numbers in it were invented. Risk 1 percent, stop at 50 points, no more than three trades a day. Where did those come from? Usually from a video. A number you cannot derive is a number you will abandon the first time it is inconvenient, because you never actually believed it.
Nothing happens when you break one. This is the big one, and it is the reason the other two persist. In every real business a control breach produces a record and a consequence. In a one person trading business the breach produces a small private feeling, and feelings are not an enforcement mechanism.
So before the checklist, the arithmetic that gives it teeth.
What Breaking One Rule Actually Costs
I ran a simulation, because I wanted the price of a breach rather than a lecture about it. The assumptions are deliberately ordinary and stated so you can rebuild it: 200 trades, a 40 percent win rate, winners paying twice what losers cost, which works out at an expectancy of plus 0.20R per trade. A modest but genuinely profitable operation. Baseline risk is 1 percent of equity per trade. I ran 40,000 of these years.
Then I broke one rule. Not habitually, just occasionally: on one trade in twenty, the position goes on at four times the normal size. Everything else identical.
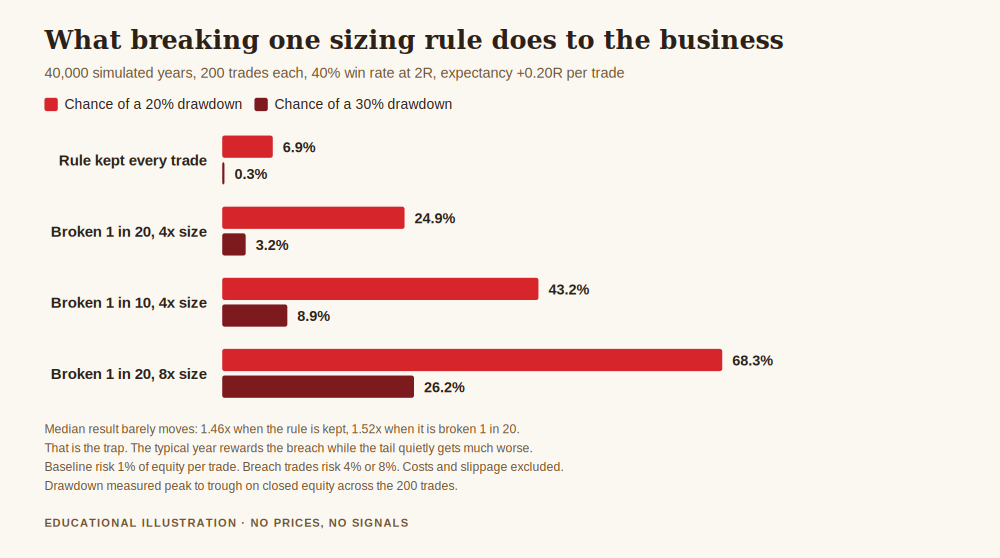
Keeping the rule on every trade, the chance of suffering a 20 percent drawdown across those 200 trades was 6.9 percent, and the chance of a 30 percent drawdown was 0.3 percent.
Breaking it on one trade in twenty, the chance of a 20 percent drawdown rose to 24.9 percent, and the chance of a 30 percent drawdown rose to 3.2 percent. That is roughly three and a half times the risk of the first, and more than ten times the risk of the second, bought with a breach that happens ten times a year.
Push it to one trade in ten and the 20 percent drawdown becomes 43.2 percent likely. Keep the frequency at one in twenty but make the breach eight times normal size instead of four, and it reaches 68.3 percent, with better than a one in four chance of a 30 percent hole.
The finding that explains why you keep doing it
Here is the part I did not expect, and it is the most useful thing in this article.
The median outcome barely moved. Keeping the rule, the typical year ended at 1.46 times starting equity. Breaking it one trade in twenty, the typical year ended at 1.52 times. Slightly better.
Read that again. In the ordinary year, breaking the rule pays you. The oversized position is more often a winner than not in a positive expectancy system, so the feedback you personally receive is mild encouragement. The cost does not show up in the middle of the distribution at all. It shows up in the tail, as a tripling of the chance of the drawdown that ends the business.
This is why rule breaches are so persistent, and why treating them as a character flaw gets you nowhere. You are not being irrational. You are responding accurately to the feedback you can see, and the feedback you can see is missing the part that matters. A checklist exists to represent the part you cannot feel.
The Trading Rules Checklist Itself
Six controls. Each one has a trigger, a threshold and a consequence, and each threshold is derived rather than borrowed.
1. The per trade risk ceiling
One number, fixed in advance, applied to every position without exception. The simulation above is the argument for it: the ceiling is not there to improve your returns, it is there to keep the tail survivable. Derive yours from the drawdown you could actually sit through rather than from a number you heard. If a 20 percent fall would make you stop trading, you need to know how likely your current sizing makes that.
2. The daily loss limit
A threshold at which the platform closes for the day, stated in R rather than in currency so it does not drift with account size. The purpose is to cap the worst possible day rather than to improve the average one. Its cost is real and worth naming: you will occasionally be stopped out of a day that would have recovered.
3. The maximum concurrent exposure
Three positions in correlated instruments is one position with extra paperwork. The rule states the total risk that may be live at any moment, counting correlated trades as a single exposure. This is the control that most often fails silently, because each individual trade complied with rule one.
4. The conditions blackout
A stated list of moments when you do not open anything: minutes around scheduled high impact releases, the first minutes of a session if that is where your slippage lives, and any time you cannot state the reason for the trade in a sentence. Note the last one is observable, unlike be patient.
5. The post loss cooling rule
The specific trigger for the breach the simulation priced. After a loss, or after two, the next position takes normal size or no size. This is where the four times position gets opened in real life, and it is the single most valuable line in the checklist.
6. The review cadence
A fixed appointment, weekly, where the books get read rather than the market. Without this the other five rules have no audit, and an unaudited control is not a control. What to read is covered in the metrics every trading business should track.
Setting the Numbers From Evidence
A checklist full of numbers you cannot defend will not survive its first bad week. So derive them, and the instrument itself will tell you most of what you need. I measured the published LBMA gold benchmark across 2016 to 2025, which gives 2,505 day-on-day comparisons.
- The median day moved 0.48 percent.
- A move of 1 percent or more happened on 21.64 percent of days, about one day in five.
- A move of 2 percent or more happened on 4.35 percent of days, about one day in twenty three.
- A move of 3 percent or more happened on 0.92 percent of days, about one day in a hundred and nine.
- The largest single day move in the decade was 5.27 percent.
Now the numbers in your checklist stop being arbitrary. A stop placed inside the median daily range is not a tight stop, it is a stop inside the noise, and it will be hit by ordinary Tuesdays. A sizing decision that assumes a 1 percent adverse move is a rare event is contradicted by the record, which says you should expect one about weekly. And a plan that has never considered a 5 percent day has an untested assumption in it, because the decade contains one.
That is the whole method: take the threshold you were going to guess, and instead read it off the instrument. The same exercise on your own market takes an afternoon and the source is public.
Enforcement, the Part Everyone Skips
The checklist is the easy half. Here is the half that makes it a control system.
Log the breach, not the trade. One line: which rule, what the trigger was, what you did instead. The log is not for punishment, it is for pattern. Most traders discover their breaches cluster into one or two situations, almost always emotional and almost always predictable, which turns a discipline problem into a scheduling problem.
Count them weekly and treat the count as a metric. Breaches per week belongs next to your expectancy and your drawdown, and it is more actionable than either because you control it directly.
Attach a consequence you will actually apply. The one that works is size reduction: after a breach, the next trading day runs at half size. It is proportionate, automatic, and it is the same lever the breach abused, which makes it feel like accounting rather than punishment.
Make the rule enforceable by the platform where possible. A daily loss limit your software enforces is worth more than one your intentions enforce. Anything you can hand to a machine, hand to a machine, because the version of you that breaches rules is precisely the version who will not be consulting a document.
Outside your own business, whole regulatory frameworks exist for the same reason, and the public education material at the CFTC is a reasonable reminder that written controls and disclosures exist because informal ones failed at scale.
Get the free REX one page business plan, the sheet where your risk ceiling, your daily limit and your review cadence live together where you will actually see them. One email, no spam, unsubscribe anytime.
Get the free business plan →Frequently Asked Questions
How many rules should a trading rules checklist have?
Few enough that you can recite them without reading them, which in practice means somewhere between five and eight. A twenty item list is not a control system, it is a document, and the difference shows up on the day you most need it. Six is what I run because six fits on the same page as the rest of the plan.
What is the single most important rule?
The per trade risk ceiling, and it is not close. It is the rule the simulation in this article prices directly: breaking it on one trade in twenty took the chance of a 20 percent drawdown from 6.9 percent to 24.9 percent. Every other rule protects the account at the margins. That one protects whether there is an account.
If breaking the rule slightly improved the median result, why not break it?
Because you do not get the median, you get one path drawn from the whole distribution, and the distribution got considerably worse in the part that ends businesses. Trading the tail for a small improvement in the middle is the same trade that insurers take the other side of, and they are the ones with the buildings.
How do I set my own numbers instead of copying yours?
Measure the instrument, then measure yourself. The instrument tells you what an ordinary day and a bad day look like, which is the exercise done above on the gold benchmark. You tell you what size of drawdown you would actually sit through rather than the one you claim you would. Set the ceiling from the smaller of what the arithmetic permits and what your temperament permits.
What if I break a rule and the trade wins?
It still goes in the breach log, and this is the case that decides whether the log is real. A breach that made money is the most dangerous kind, because the outcome argues for repeating it while the process argues against it. Judge the decision, not the result, or the log will quietly train you to do the wrong thing.
Do these rules apply to a small account?
More so, not less. A small account has less capacity to absorb a deep drawdown in absolute terms and is usually run by someone earlier in the learning curve, which is exactly the combination the tail punishes. The rules are also easier to install now than to retrofit after a habit has formed.
How is this different from a trading plan?
The plan says what the business does. The checklist says what the business will not do, and defines how you will know when it has. Both belong on the same page, and the one page trading business plan template is where I keep them together.
Where This Leaves You
A trading rules checklist is not a promise you make to yourself on a Sunday. It is a set of controls with derived thresholds, an audit trail, and a consequence that fires without requiring your cooperation in the moment.
The reason to build it properly is in the simulation. The cost of an occasional breach is invisible in the ordinary year, and in the ordinary year it is very slightly rewarded. It is only visible in the frequency of the drawdown that closes the account, and by the time that arrives the rule was needed several hundred trades ago.
So write six rules, derive every number in them from something you can point at, log every breach including the profitable ones, and read the log weekly. That is a control system rather than a mood. It is also, unglamorously, most of the difference between a business and an expensive hobby.
The one page trading business plan template holds these six rules alongside the rest of the operation, and it is free. If you want the sizing arithmetic behind rule one in more depth, position sizing for gold trading is the companion piece, and how to manage risk in gold trading covers the ground beneath all six.
REX Trading Signal is a free Telegram channel where I post the reasoning before the outcome, losing weeks included. Nothing is sold to follow along, and there is an optional Kit if you want more structure. No profit claims are published here, for the reasons this article should make obvious.
About the author. Rex writes REX Trading Signal. He treats an account as a small business with a cost base, a capacity limit and a set of controls, on the view that most accounts are closed by ordinary operational failures rather than by any single bad trade.
Disclaimer: This article is general educational content about operational controls in a trading business. It is not financial advice and it is not a recommendation to buy or sell anything. No entry, stop or target discussed should be treated as a signal, and the rules described are a framework to adapt rather than settings to copy. Trading gold, CFDs and leveraged products carries a high risk of losing money rapidly. The drawdown and equity figures come from a Monte Carlo simulation of 40,000 sequences of 200 trades, assuming a 40 percent win rate, winners paying twice what losers cost, 1 percent baseline risk per trade and breach trades at four or eight times that, with costs and slippage excluded; they describe a model rather than any real account, and no real trading results are represented. The daily movement figures are computed from the published LBMA daily gold benchmark over 2016 to 2025 and the source is linked so you can check it. No price levels are quoted anywhere in this article.