
Most lists of forex trading mistakes are lists of feelings. Greed, fear, impatience, ego. All real, none of them actionable, because you cannot put "stop being greedy" on a checklist and tick it on a Monday morning. This is a different list. Every item here is a mistake you can measure, and most of them are arithmetic errors wearing an emotional costume. A business that fails an audit does not fail because the bookkeeper was greedy. It fails because nobody reconciled the accounts.
The one that decides whether the others matter
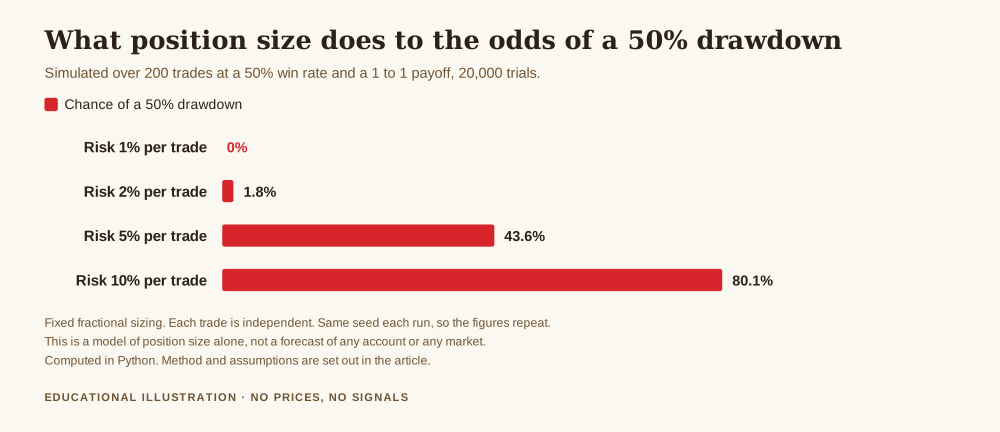
Start with position size, because it changes the maths of everything else. Here is a simulation you can rebuild in an afternoon. Take a trader with no edge at all, a 50 per cent win rate and a one to one payoff, running 200 trades with fixed fractional sizing. Run it 20,000 times and count how often the account is down 50 per cent at some point along the way.
At 1 per cent risk per trade, that essentially never happens in the simulation. At 2 per cent it happens 1.8 per cent of the time. At 5 per cent it happens 43.6 per cent of the time. At 10 per cent risk per trade, the same coin flipping trader hits a 50 per cent drawdown 80.1 per cent of the time.
Nothing changed except position size. Same win rate, same payoff, same number of trades. The trader risking 10 per cent is not more emotional than the trader risking 1 per cent, they are running a different business with a different failure rate. One reader put the problem plainly: "I don't know how to work out the lot size, can you help me". That question is more important than any question about entries, and it is asked far less often.
Forex trading mistakes that are really arithmetic mistakes
The second mistake is not knowing what a loss costs to undo. Recovery is not symmetrical, and the gap widens faster than people expect. Lose 10 per cent and you need 11.1 per cent to get back. Lose 20 per cent and you need 25 per cent. Lose 30 per cent and you need 42.9 per cent.
Then it stops being a gentle curve. Lose 50 per cent and you need 100 per cent just to return to where you started. Lose 70 per cent and you need 233 per cent. Lose 90 per cent and you need 900 per cent, which is not a recovery plan, it is a wish.
The arithmetic is simply one divided by one minus the loss. It takes thirty seconds to check and almost nobody runs it before the drawdown rather than after. One reader wrote: "New beginner, less than one year. Trading capital 100 dollars but it has reduced to 50." That is the 100 per cent row. The account now needs to double, not to profit, but to break even.
This is why risk limits exist in every other kind of business. They are not there to cap the upside. They are there to keep you inside the part of the curve where recovery is still plausible.
Reading a normal losing streak as a broken system
The third mistake destroys more good processes than bad ones. A trader has a run of losses, decides the method is finished, and changes everything. Often the run was ordinary.
You can calculate this exactly rather than guess. For a sequence of independent trades, the probability of hitting at least one losing streak of a given length can be computed with a short dynamic program, and the figures below were checked against brute force enumeration on small cases before being run at scale.
Over 200 trades at a 50 per cent win rate, the chance of seeing at least one run of 5 straight losses is 96.6 per cent. It is very close to certain. A run of 8 straight losses happens 32 per cent of the time, and a run of 10 happens 9 per cent of the time. Even at a 60 per cent win rate, which would be a strong system, a run of 5 losses still shows up 71.4 per cent of the time.
Read that again, because it reframes the whole problem. If you take 200 trades a year with a genuinely profitable method, five losses in a row is not a warning sign. It is the base case. Roughly a third of such years will also hand you eight in a row. A trader who tears up the plan after the fifth loss is not responding to evidence, they are responding to an outcome that was always going to arrive.
The business version of this control is simple. Decide in advance how many trades make a verdict, write it down, and do not let a streak shorter than that reopen the decision.
Not checking who is holding the money
The fourth mistake is the most expensive one on this page, and it has nothing to do with charts. The FBI's Internet Crime Complaint Center publishes an annual report with the numbers in it, and the 2024 edition records 859,532 complaints and 16.6 billion dollars in reported losses, a 33 per cent increase on the year before.
Inside that total, investment fraud is the single largest loss category at 6.57 billion dollars, which is 39.6 per cent of all losses reported. Yet investment complaints were only 47,919, about 5.6 per cent of all complaints filed. Divide the loss by the complaint count and the average reported investment fraud loss works out at roughly 137,000 dollars, against an average of 19,372 dollars across all complaint types. That is about seven times the typical loss.
The shape of that data is the lesson. Investment fraud is comparatively rare and catastrophically large when it lands. It is a low frequency, high severity risk, which is exactly the category that due diligence handles well and intuition handles badly. Checking a firm's registration with the regulator in its stated jurisdiction takes a few minutes. The report also lists a category it calls gold courier scams, 525 complaints and 219 million dollars, which is a reminder that the precious metals corner of this market attracts the same attention.
The practical control is unglamorous. Before funding an account, confirm the entity is registered where it claims to be, confirm withdrawals have been tested at small size, and treat any pressure to deposit quickly as the signal it is.
Treating costs as noise
The fifth mistake is quiet enough that most traders never attribute a bad year to it. Costs are small per trade and large per year, and they compound against you in the one direction that never reverses.
You are also trading in a market where you are the smallest participant present. The Bank for International Settlements measured global foreign exchange turnover at 9.6 trillion dollars a day in April 2025, up 28 per cent from 7.5 trillion three years earlier, with spot trading alone at about 3 trillion a day. Nothing in that number is an argument against trading. It is an argument against assuming you will be the one who gets the good fill.
Run the cost arithmetic as a ratio and it stops being abstract. If your stop sits 300 points away and you risk 1 per cent per trade, a 30 point spread is 10 per cent of your risk budget on every single trade. Take 250 trades a year and the spread alone has consumed 25 per cent of everything you put at risk. Our sister channel works that calculation through in detail, and the conclusion holds at any price level because it is a ratio, not a price.
The habit that prevents most of them
Look back at the five mistakes. Oversized positions, unexamined recovery maths, overreacting to a normal streak, an unchecked counterparty, and uncounted costs. Not one of them is a prediction problem. Every one of them is a record keeping problem.
A business catches these through routine, not through willpower. You know your largest acceptable position before the week starts. You know what your drawdown limit is and what it would take to recover from it. You know how many trades make a verdict. You know who holds your money and whether they are registered. You know what the month cost to run.
One reader described the trap exactly: "The most painful part for beginners is they want to get paid overnight." Another wrote something more encouraging: "I'm a beginner, and trading is not my main source of income. I trade with small capital mainly to learn and gain experience." The second person has already avoided most of this list, because they have set the size of the thing to match what they are actually doing, which is learning.
Of roughly 133 messages in my inbox that mention beginner mistakes, counted by keyword rather than by any survey, the common thread is almost never a bad entry. It is an account sized wrongly for the knowledge behind it. One reader summed up the whole page in a sentence: "I realised lately I haven't been using a stop loss, and that is why I lost so much."
Get the free REX one page trading business plan, with the risk limit, the review cadence and the cost lines on a single sheet, so the mistakes on this page have somewhere to be caught. One email, no spam, unsubscribe anytime.
Get the free business plan →Frequently asked questions
What is the most common forex trading mistake?
Position size, measured by the damage it does. In a simulation of 200 trades at a 50 per cent win rate and a one to one payoff, risking 10 per cent per trade produced a 50 per cent drawdown 80.1 per cent of the time, while risking 1 per cent essentially never did. Same trader, same method, different business.
How many losing trades in a row is normal?
More than most people expect. Over 200 independent trades at a 50 per cent win rate, a run of five losses appears 96.6 per cent of the time, eight in a row 32 per cent of the time, and ten in a row 9 per cent of the time. A streak on its own is not evidence that a method has stopped working.
How much do I need to make back after a loss?
More than you lost, and the gap grows quickly. Down 10 per cent needs 11.1 per cent, down 20 needs 25, down 30 needs 42.9, down 50 needs 100 and down 70 needs 233 per cent. The formula is one divided by one minus the loss, which is worth running before a drawdown rather than during one.
How do I avoid losing money to a fraudulent broker?
Check registration with the regulator in the jurisdiction the firm claims, test a withdrawal at small size before funding properly, and treat urgency as a warning. The FBI's 2024 report put investment fraud losses at 6.57 billion dollars from 47,919 complaints, an average near 137,000 dollars, roughly seven times the average loss across all complaint types.
Are forex trading mistakes mostly psychological?
They are usually described that way and usually resolved another way. Oversized positions, unexamined recovery maths, misread losing streaks, unchecked counterparties and uncounted costs are all measurable, and all of them are caught by a written limit and a regular review rather than by trying harder to stay calm.
Where REX Trading Signal fits
REX Trading Signal is free to follow. The daily record on Telegram includes losing days, because a record that only shows winners is not a record. There is a free one page trading business plan for anyone who wants the limits and the review cadence in one place, and an optional Kit for people who want the full operating method. Nothing here promises a profit and nothing here is a signal service. The foundation this article sits on is the one page trading business plan template, the sizing arithmetic is in position sizing for gold trading, the review habit is in your monthly profit and loss review, and the cost side is in the fixed and variable costs of a trading business.
About the author. Rex writes REX Trading Signal and treats an account the way an operator treats a business, with limits set before the week starts and a review that happens whether the month was good or bad. He is less interested in what a trader thinks will happen next than in whether their records would survive someone else reading them. The figures here come from the published sources linked above, the simulations state their assumptions so you can rebuild them, this is not financial, accounting, legal or tax advice, and no entry, stop or target discussed should be treated as a signal.